Analytics Dashboard
HYPR Control Center Standard
HYPR Control Center includes a free Dashboard that captures useful Control Center (not RP Applications) data to better help you understand what's happening on your server. This feature is enabled by default; contact HYPR Support for assistance if you would like it disabled for your environment.


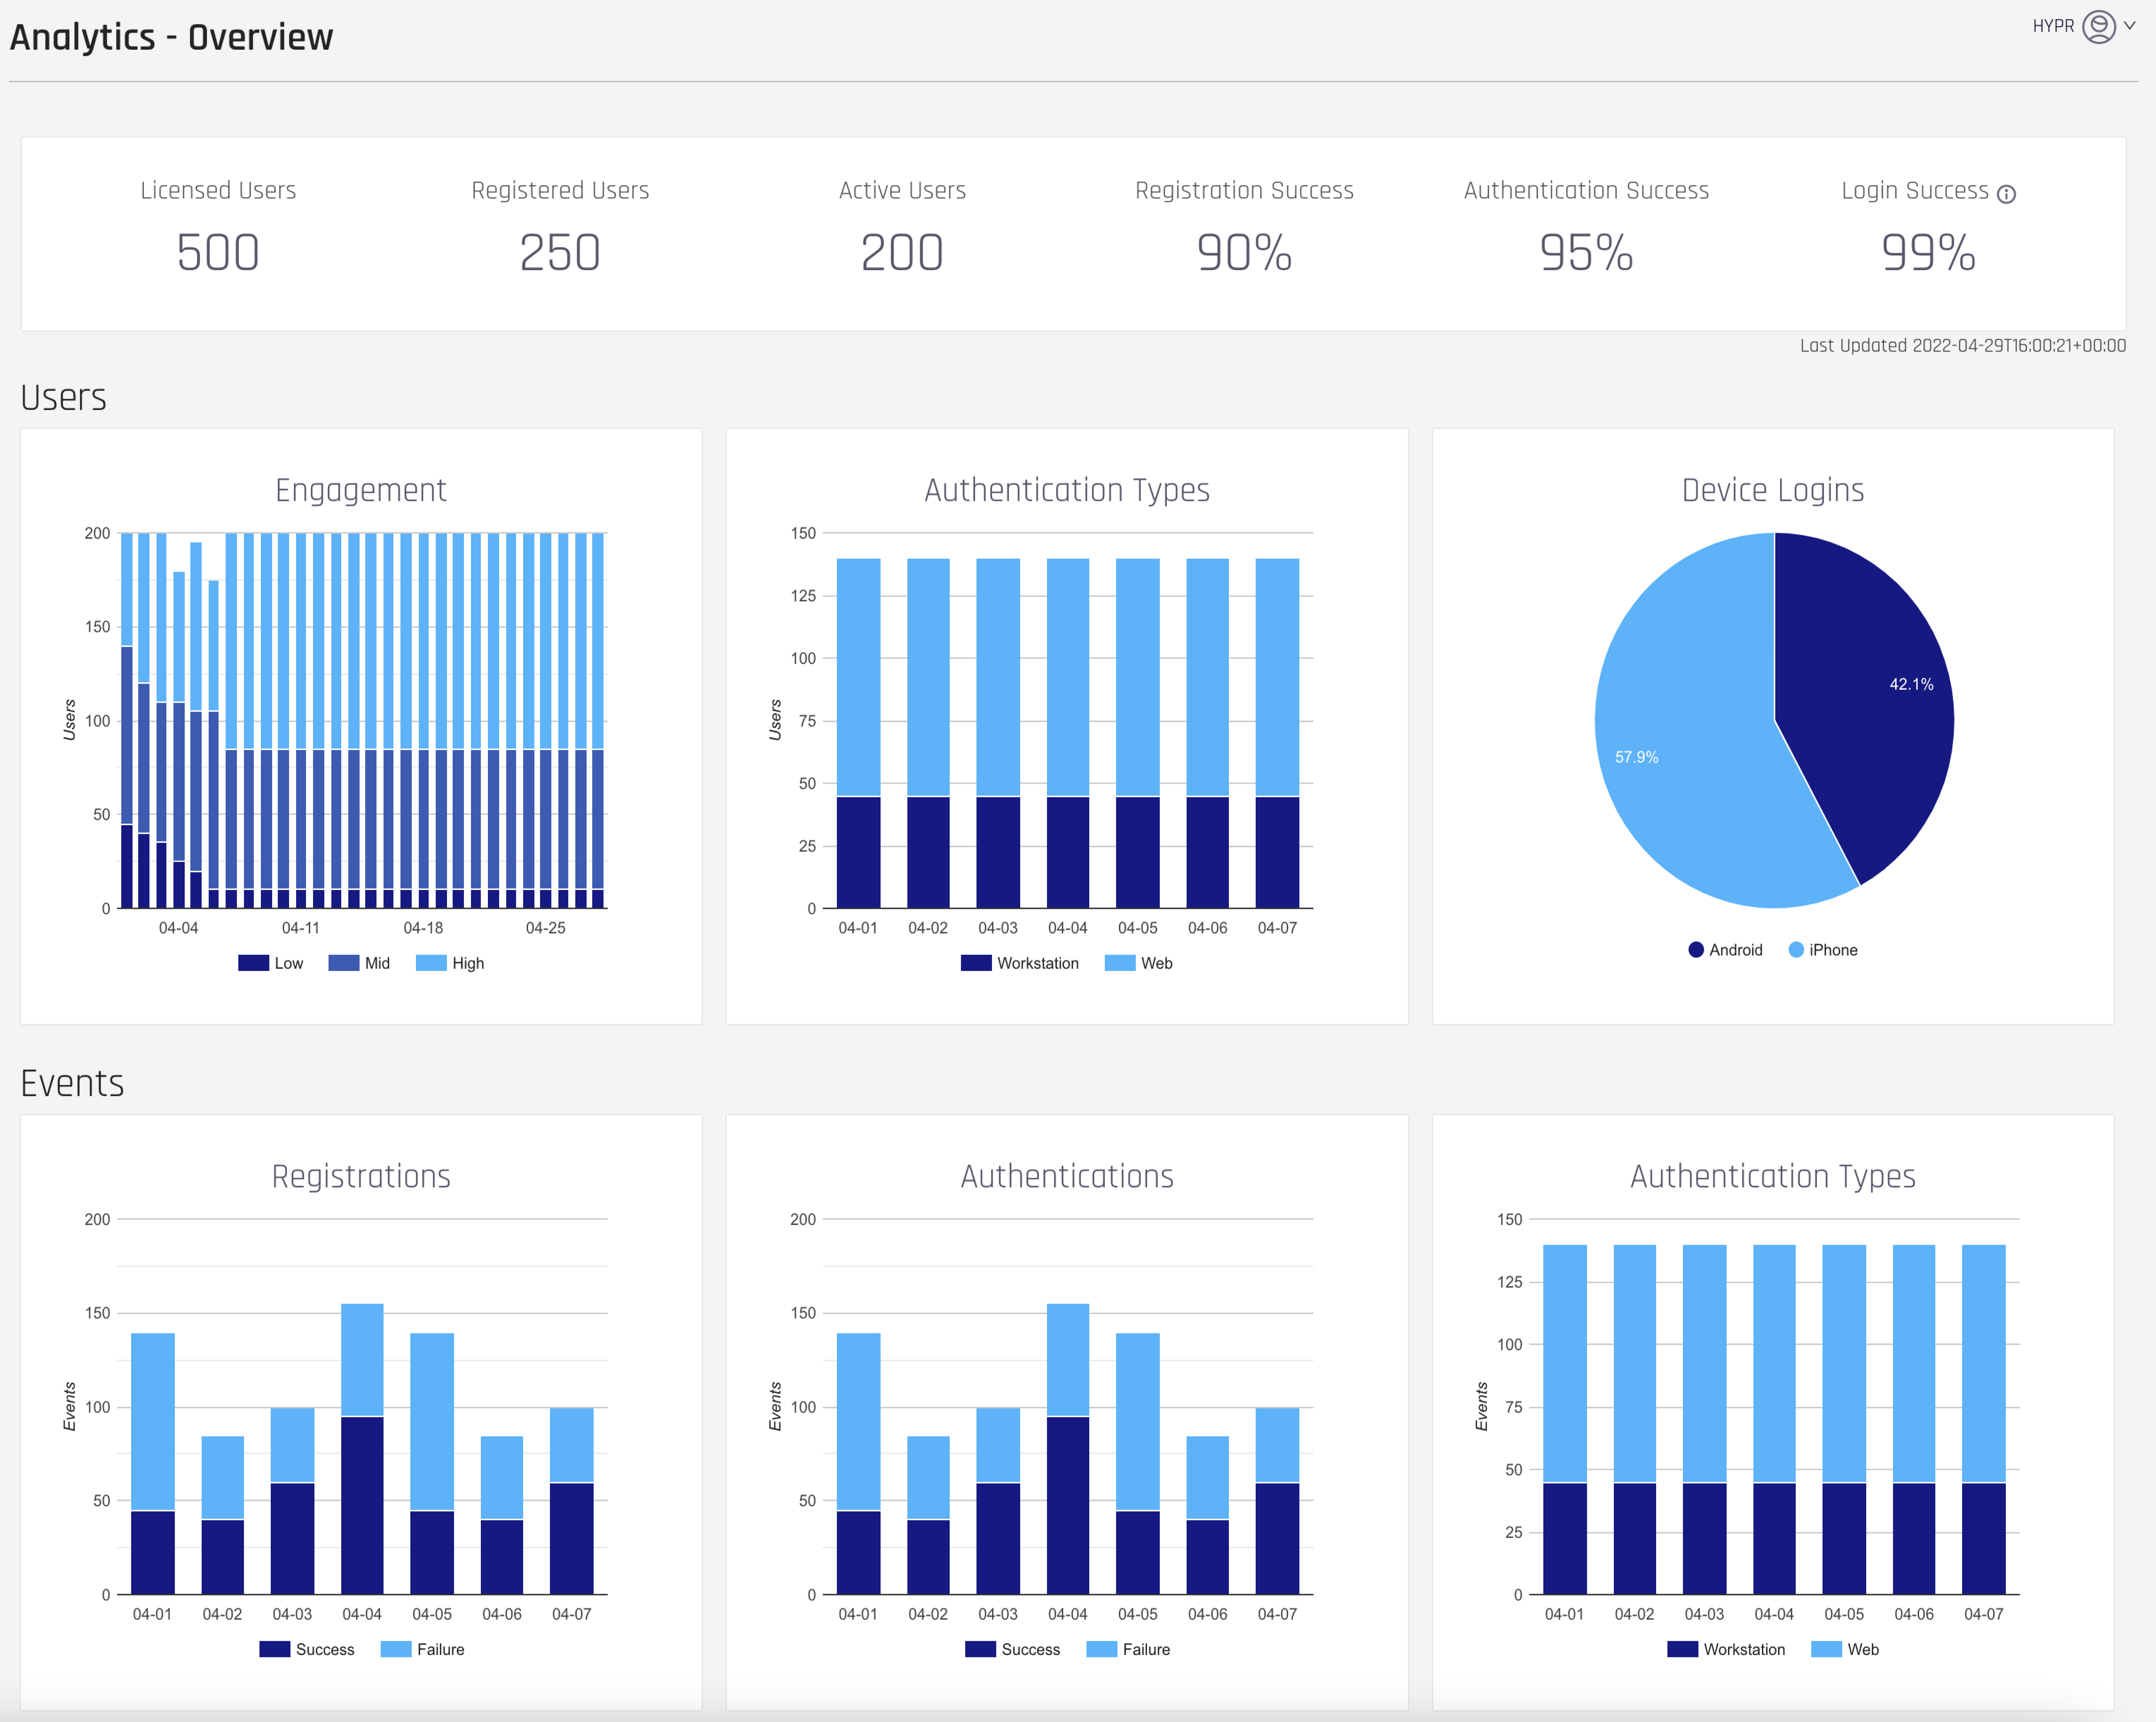
Control Center Analytics features a standard overview dashboard which covers the following metrics:
Dashboard Metrics
Metrics for All Time
- Licensed Users: Total number of licenses the customer has purchased from HYPR to date
- Registered Users: Total number of end users who have successfully registered to date
- Active Users: Total number of end users who have successfully authenticated at least once to date
- Registration Success (%): (Number of successful registration events) ÷ (Number of registration attempts to date)
- Authentication Success (%): (Number of successful authentication events) ÷ (Number of authentication attempts to date)
- Login Success (%): (Number of successfully authenticated users) ÷ (Number of users who have attempted to authenticate to date)
Metrics for the Last 30 Days
User and Device Level
- Engagement: Trending data of Low/Mid/High user engagement, measured by the number of successful authentications over the last 30 days:
- Low: 1 - 10
- Mid: 11 - 40
- High: 41+
- Authentication Type bar chart: 30-day trending data of unique users authenticating by either Workstation or Web integration
- Device Logins: Percentage of unique device types that have been used to successfully authenticate in the last 30 days:
- Android
- iOS
- Unknown
Event Level
Bar charts of common Events over the last 30 days:
- Registrations: (Success/Failure)
- Authentications: (Success/Failure)
- Authentication Types: (Workstation/Web)
Updated 5 months ago
