Posture and History
Two console pages answer two questions about your input guardrails: what needs attention now, and what has been happening over time. Any role with Guardrails: View can open both: Admin, Operator, Security analyst, Auditor and Model governance owner, out of the box.
Guardrails Posture
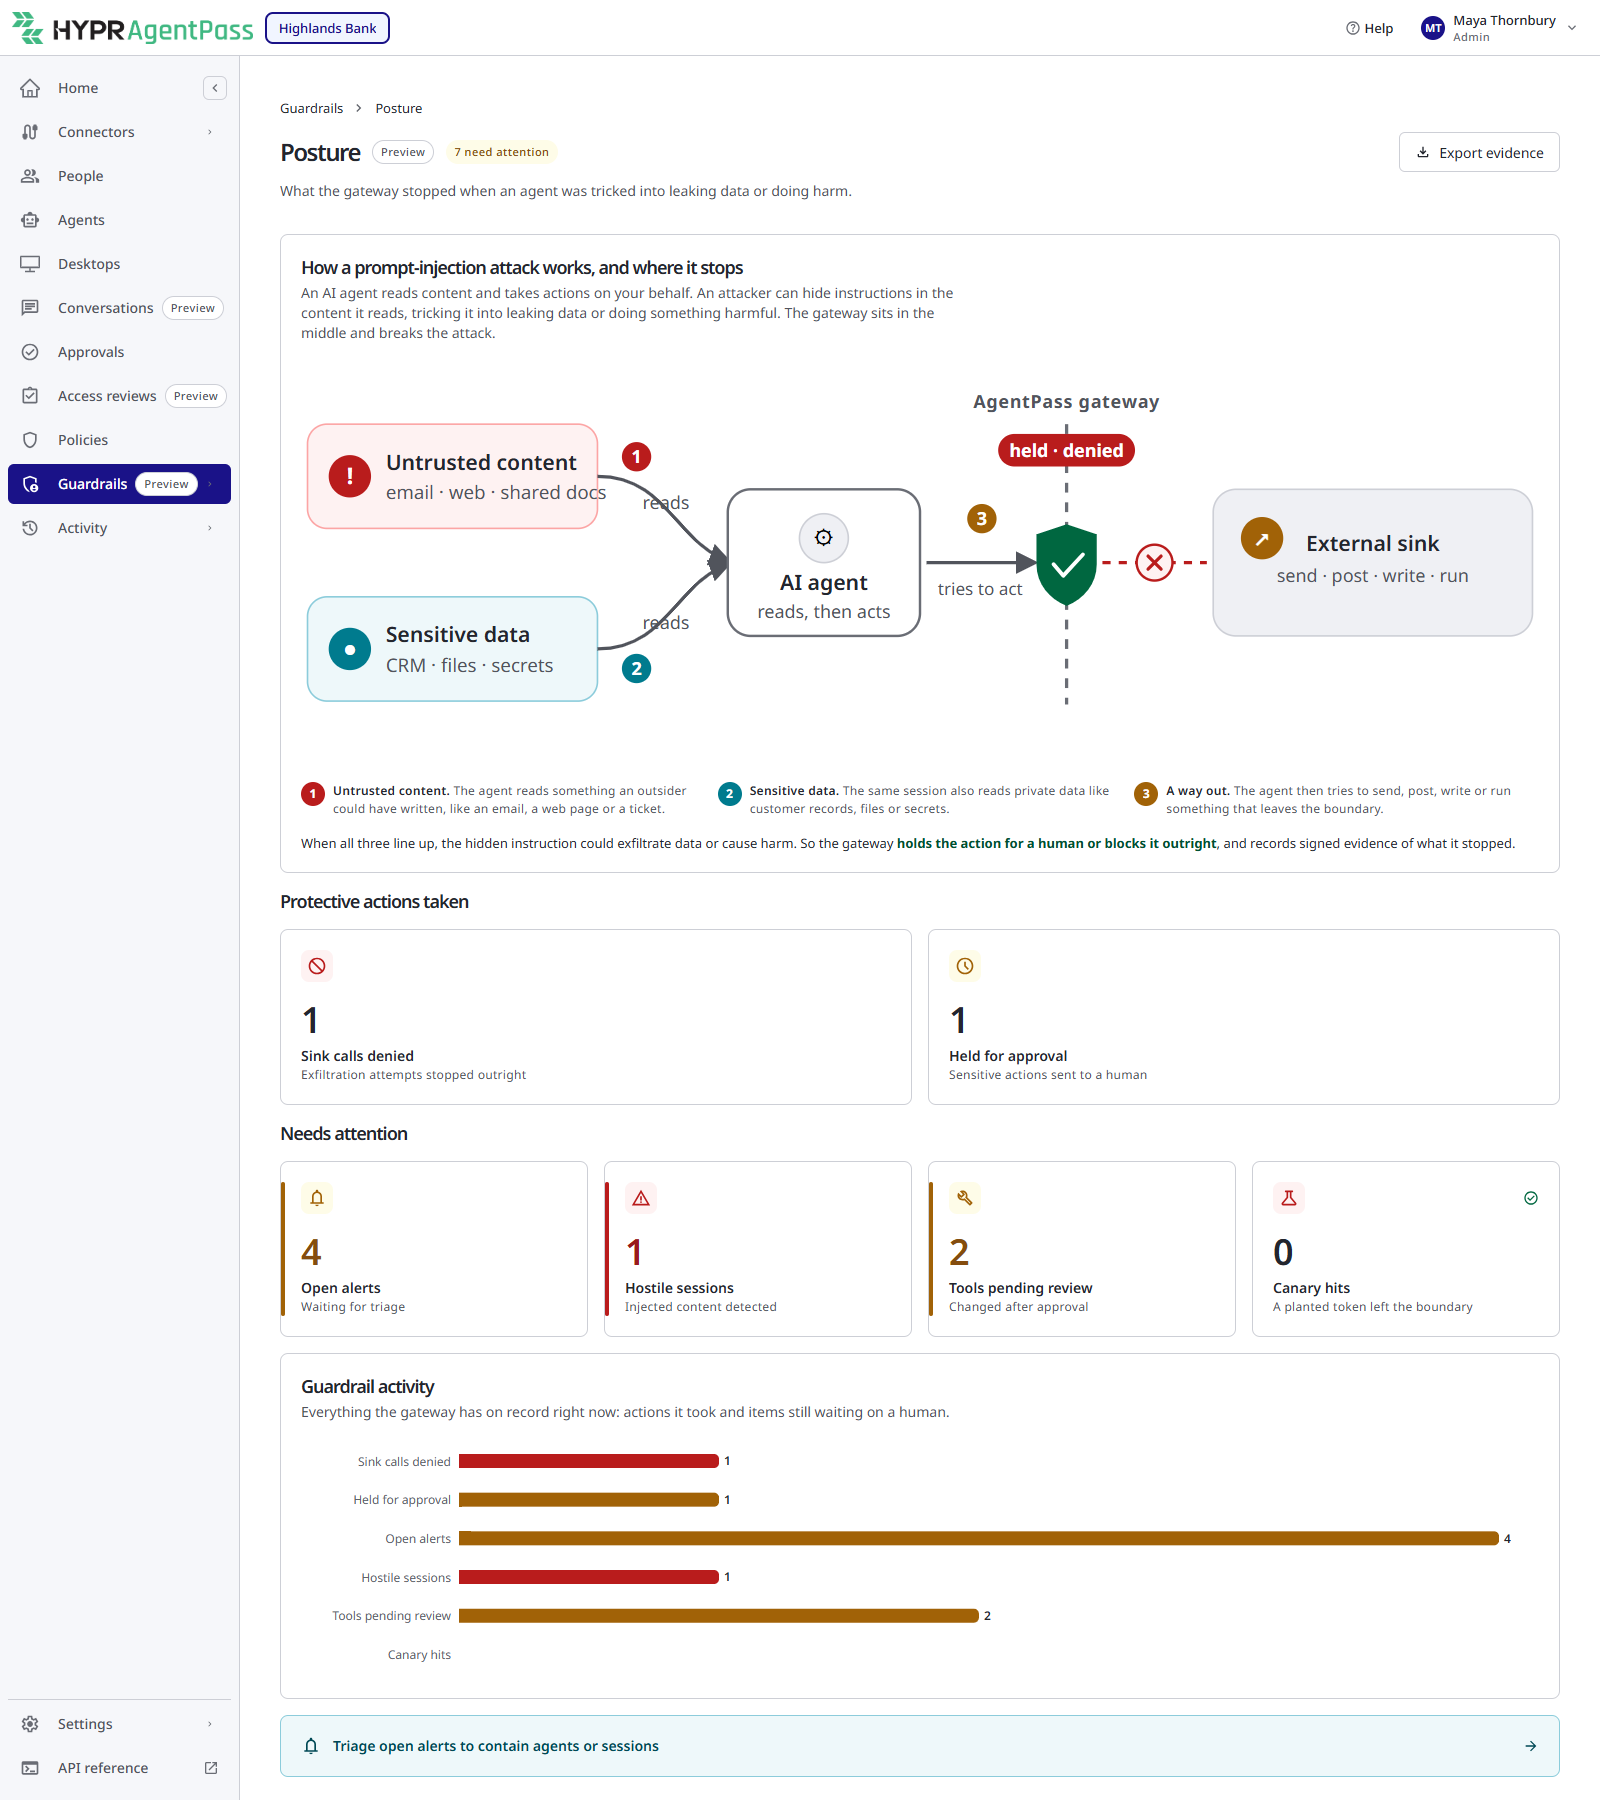
Guardrails → Posture opens Posture, a single page of everything the gateway has on record right now. When items need attention, a badge in the header counts them, such as 2 need attention. With nothing outstanding, the header has no badge. Export evidence sits beside it. See Evidence Export.
A diagram, How a prompt-injection attack works, and where it stops, shows where the breaker steps in. The page's six tiles come in two groups. A tile in Needs attention with nothing outstanding shows a check mark.
| Group | Tile | Counts | Selecting it opens |
|---|---|---|---|
| Protective actions taken | Sink calls denied | Open alerts for exfiltration attempts the breaker stopped outright | History, filtered to denied calls |
| Protective actions taken | Held for approval | Open alerts for sensitive actions the breaker sent to a person | History, filtered to held calls |
| Needs attention | Open alerts | Alerts waiting for triage | Guardrails → Alerts |
| Needs attention | Hostile sessions | Sessions where injected content was detected | History, filtered to hostile sessions |
| Needs attention | Tools pending review | Tools whose definition changed after approval and has not been reviewed | Connectors, which needs Connectors: View |
| Needs attention | Canary hits | Times a planted token left the boundary | History, filtered to canary hits |
The header badge adds up the four Needs attention tiles. A Guardrail activity chart repeats all six counts side by side. Below it, a bar links to Guardrails → Alerts.
Guardrails History
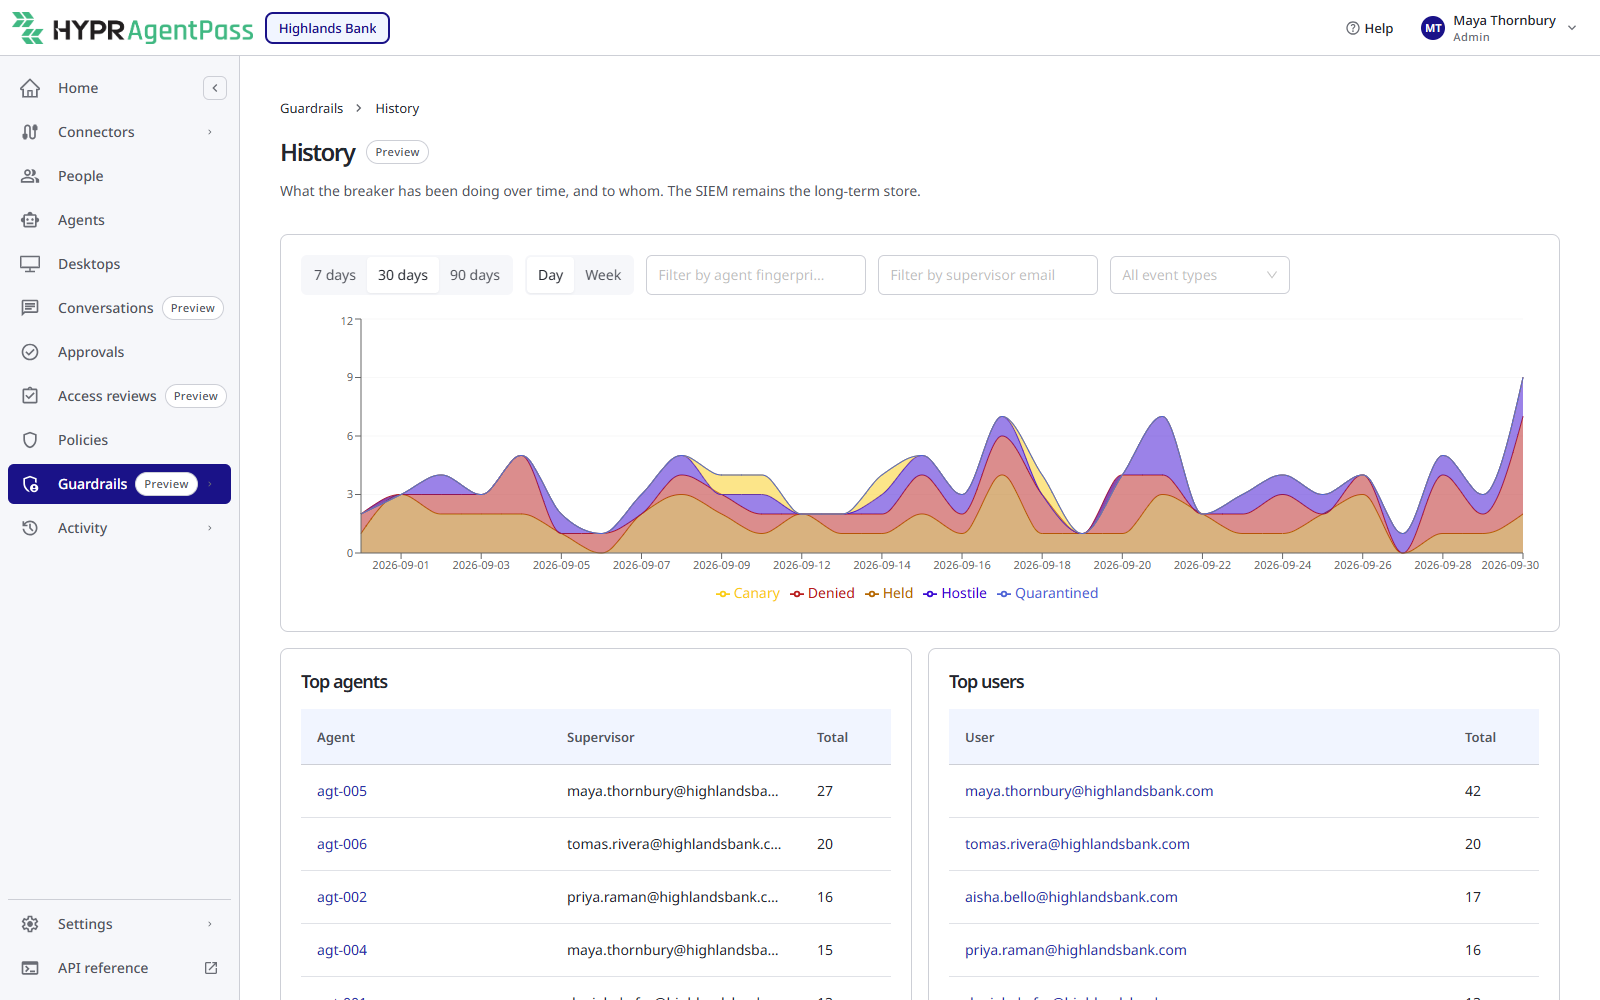
Guardrails → History opens History, which trends what the breaker has done over time, and to whom. Use it to see whether injection pressure is rising or falling, or to spot a change after you onboard a connector. It also shows a reviewer the shape of activity across a period. Your SIEM remains the long-term store.
These controls set the view:
- Range: 7 days, 30 days or 90 days.
- Bucket: Day or Week.
- Filter by agent fingerprint and Filter by supervisor email narrow the view to one agent or one person.
- Event: All event types, or one of Held, Denied, Hostile, Canary or Quarantined.
Two leaderboards list the Top agents, with each agent's supervisor, and the Top users. Select a row to open that agent's or user's history, with when each event happened, the event, connector, tool, sink and tier.
The Alerts page is for working a live incident, and Posture is for the state right now. History is for the retrospective: the view you bring to a weekly review or hand to an auditor.
Related
- Guardrails Overview
- Alerts and Containment — working a live guardrail alert
- The Proving Ground — proving the defenses work, with evidence
- Home — the gateway's wider activity view