Session Watch: Findings Across Sessions
The Findings tab on Activity › Session watch lists the findings from every watched session in one place, grouped. You can review what evaluators reported without opening sessions one at a time. Beside the list, an entity graph shows which hosts, files and commands those findings touched. The tab shows open findings by default, from the time range chosen in the page header.
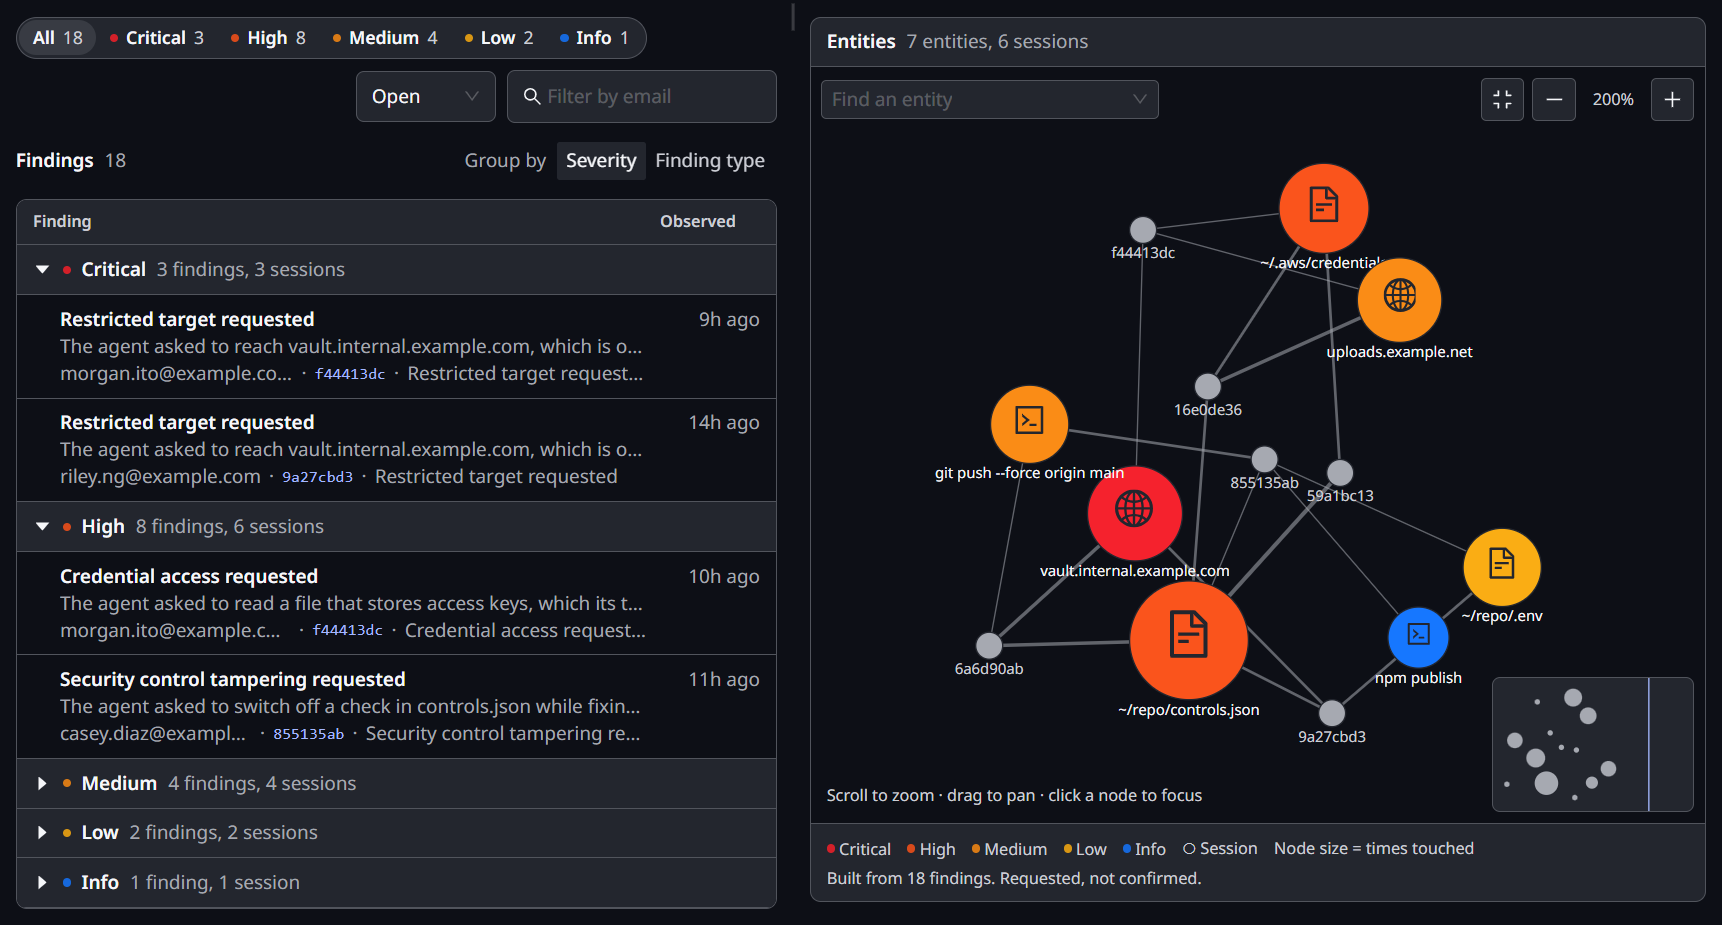
A line beneath the list repeats the caveat that matters most: these findings describe activity the agent requested, not activity that is confirmed to have happened. Each finding's drawer carries the requested tag. See What a Finding Proves.
Grouping the List
Choose how the list is grouped with Group by:
- Severity, the default. One group per severity, Critical first.
- Finding type. One group per category, such as Restricted target requested. The group holding the most severe finding comes first.
Each group's header shows the group's name, and how many findings and sessions it holds, such as 7 findings, 5 sessions. Its colored dot is the severity of the most severe finding in it. Select a header to expand or collapse the group. Low and Info start collapsed. When the list is focused on an entity or a session, every group starts expanded.
Within a group, the newest findings come first. Select Load more at the end of a group to see its older findings.
Grouped by finding type, a finding whose severity differs from its group's shows its own colored dot. Hover the dot for its severity.
Narrowing the List
- Severity chips. One chip per severity, Critical first, each with its count. Select a chip to show only that severity; select several to combine them, and select a chip again to remove it. All clears the selection. The counts reflect your other filters but not your severity selection, so every chip always shows its number.
- Status. Open (the default), Dismissed, or All.
- Filter by email. Enter a person's email address, for example
grace.hopper@hb.com, to see only the findings from their sessions. - Focus. One entity or session, chosen in the entity graph or from a finding's Entities row. A chip above the list names it: Showing findings for …. Close the chip to clear it.
- Time range. Set in the page header, and shared with the Sessions tab.
Your filters, grouping and focus, and the finding you have open, are all part of the page's address. Copy the address from your browser to share exactly the view you are looking at, such as open Critical findings, with a colleague who has access. Or bookmark it for your own daily review.
Reading a Finding
Each row in the list shows the following.
| Part | Shows |
|---|---|
| Title | The evaluator's title, or the category when there is no title. A dismissed tag when the finding has been dismissed |
| Rationale | The evaluator's reasoning, on one line. Hover it to read it in full |
| Person | The person whose session it was. For traffic with no identifiable person, Unattributed |
| Session | The session, as a short identifier. Select it to open the session page. Back to Session Watch returns you to this list with your filters intact |
| Category | The finding's category, when the list is grouped by severity |
| Observed | How long ago the evaluator reported it. Hover for the exact time |
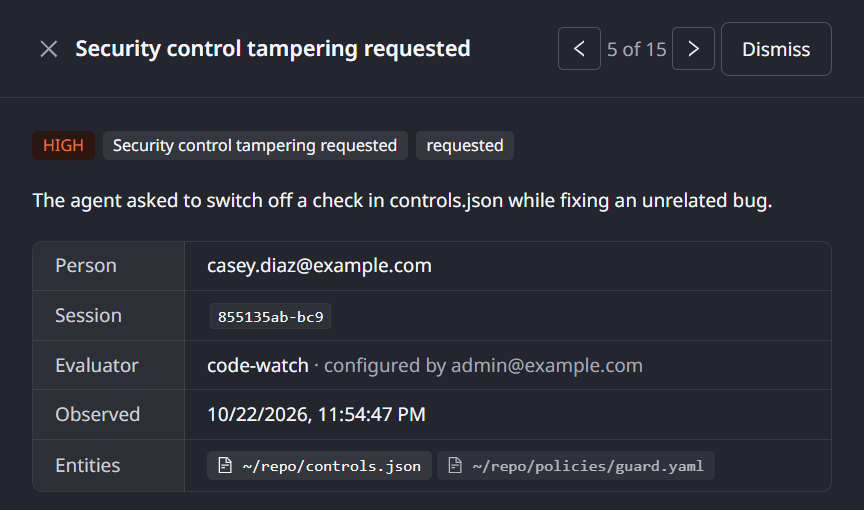
Select a row to open the finding in a drawer. It shows:
- the finding's severity, category,
requestedtag and rationale; - the person, session, evaluator and who attached it;
- when it was observed and, if it was dismissed, by whom;
- Entities: the hosts, files, commands and tools the finding touched, each of which you can select to show only its findings;
- the Cited request, with its time, type, tool and arguments;
- the Digest it came from.
To step through the findings in the expanded groups, use the previous and next arrows in the drawer's header. The header says where you are, such as 3 of 12. At the end of a group with more findings, the next arrow loads them.
The list does not rearrange itself while you read it. When new findings arrive, a notice says so and offers Refresh.
Seeing What Findings Touched
The Entities panel beside the list shows what the findings in the list touched: the hosts, files, commands and tools their requests named, and the sessions they came from. A file that draws findings in five sessions appears as one large node, not as a dozen rows.
On a wide screen, the panel sits beside the list, and you can drag the divider between them. On a narrower screen, it follows the list.
The graph is built from the list's time range, severity, status and email filters. Focusing on an entity or a session dims the rest of the graph, but does not redraw it. The panel header counts the entities and sessions it shows.
Reading the Graph
The graph has two kinds of node, joined by lines.
| Element | Shows |
|---|---|
| Entity node | One host, file, command or tool under one finding type. Its size shows how many times it was touched, and its color is the severity of the most severe finding that touched it. Larger nodes carry an icon for their type |
| Session node | A gray circle for each session whose findings touched an entity |
| Line | Links a session to an entity it touched. A thicker line means more touches |
The same target flagged under two finding types appears as two entities. Labels appear as you zoom in. Each node's accessible name states its counts, such as controls.json, touched 12 times, in 5 sessions.
Moving Around the Graph
- Zoom: scroll, or use the + and − buttons.
- Pan: drag the graph.
- Fit: shows the whole graph again.
- Center on focus: brings the focused node back into view.
- Minimap: click a spot to move the view there.
From the keyboard, focus the graph. Use + and − to zoom, 0 to fit, and the arrow keys to pan. Tab moves between nodes, and Enter selects one.
Finding an Entity
Type part of a name into Find an entity. It searches every entity under the list's filters, and lists the matches grouped by severity. Matching nodes in the graph are highlighted as you type. Pick a match to focus on it and center it.
Focusing on an Entity
Select an entity node, or pick one from Find an entity. Three things happen:
- The list narrows to the findings that touched it, and a chip names it.
- Nodes not connected to it are dimmed.
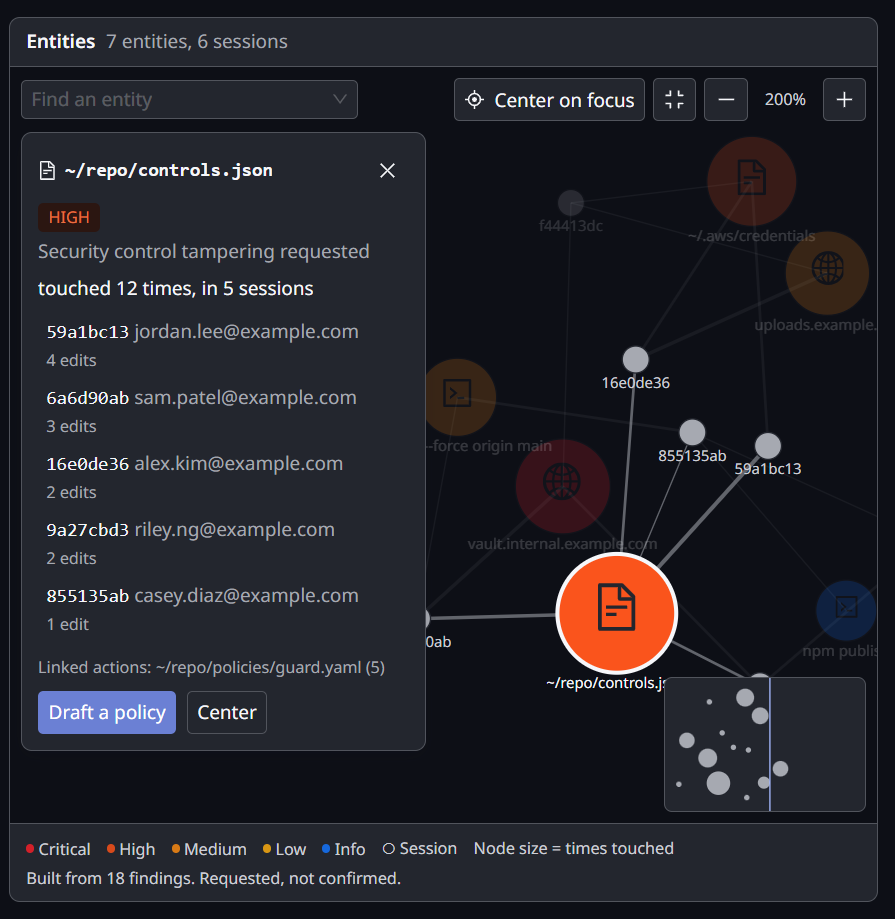
- A focus card opens over the graph.
The focus card shows:
- the target, its type, the severity of its most severe finding, and its finding type;
- how often it was touched, such as touched 12 times, in 5 sessions;
- up to five sessions, each with its short identifier, its person and what was requested, such as 2 edits or 1 read, 1 edit;
- +2 more sessions, when there are more;
- Linked actions: other targets requested in the same requests, each with a count, such as rm .controls.sha256 (2);
- Draft a policy, for roles that can add policies. See Drafting a Policy from an Entity;
- Center, which brings the node back into view.
Some findings cite a request that made several calls, without naming the call they were about. When an entity was counted from such requests, the card says so: From requests with several calls; the finding did not name this target. Read the cited requests before you act on it.
Select a session on the card, or a session node, to focus on that session instead. The list narrows to its findings, and the card shows its person, how many findings and entities it has, and Open session.
To clear the focus, select the focused node again, close the card, or close the chip over the list.
The Graph Footer
Beneath the graph, a legend explains the colors and node sizes. A line then says how many findings the graph is built from, and how many of them have no entity. A finding about the session as a whole has none, for example. When there are more entities than the graph can show, the line says so: narrow the time range, or use Find an entity. The line ends with a reminder: Requested, not confirmed.
Drafting a Policy from an Entity
An entity that keeps drawing findings is a candidate for a policy. On its focus card, click Draft a policy. The New policy wizard opens with Describe it in your own words chosen. The connector that most of the entity's requests went through is already picked, and the goal is already written:
Block edits to controls.json. Session Watch evaluators flagged it as "Security control tampering requested" (HIGH): requested 12 times in 5 sessions in the last 24 hours.
The goal is written from the entity's target, finding type, severity, counts and time range, never from an evaluator's own words. You can change the goal and the connector. Nothing is drafted until you ask. See Authoring a Policy with AI.
Dismissing a Finding
Roles that manage Session Watch can select Dismiss on a finding they have dealt with. It leaves the Open list and the counts drop. Dismissing from the drawer moves you on to the next finding. The finding is kept, not deleted: switch Status to Dismissed or All to see it again, marked dismissed, with who dismissed it.
When the List Is Empty
An empty list says: No findings in this window. That is not an all-clear, and the list says so. Only sessions an evaluator is watching are reviewed, and an evaluator reviews only what it has been sent. To see who is not being watched at all, select the Not watched pill on the Sessions tab, or group it by person.
If your role cannot read request content, the tab tells you which permission is missing instead of showing an empty list (see Who Can Do What).
Related
- Session Watch: Findings — what a finding carries and proves, and how to read one on a session
- Session Watch — what an evaluator is, the Session Watch page and who can do what
- Authoring a Policy with AI — how a drafted policy is reviewed, backtested and saved