Home
Home is the first page of the HYPR AgentPass™ console, and the first entry in the sidebar. On one screen, it shows what is connected, what is running, and what people have been asked to decide.
You need Request log: View to see Home. Its scope decides how much of your organization the page covers. See What You See Depends on Your Role.
The Setup Guide
For an administrator, Home opens with Set up AgentPass: eight steps in three cards, from your first connector to your first approval policy. You see the guide when your role has Settings: Edit, which Admin has. Every other role sees Home without it.
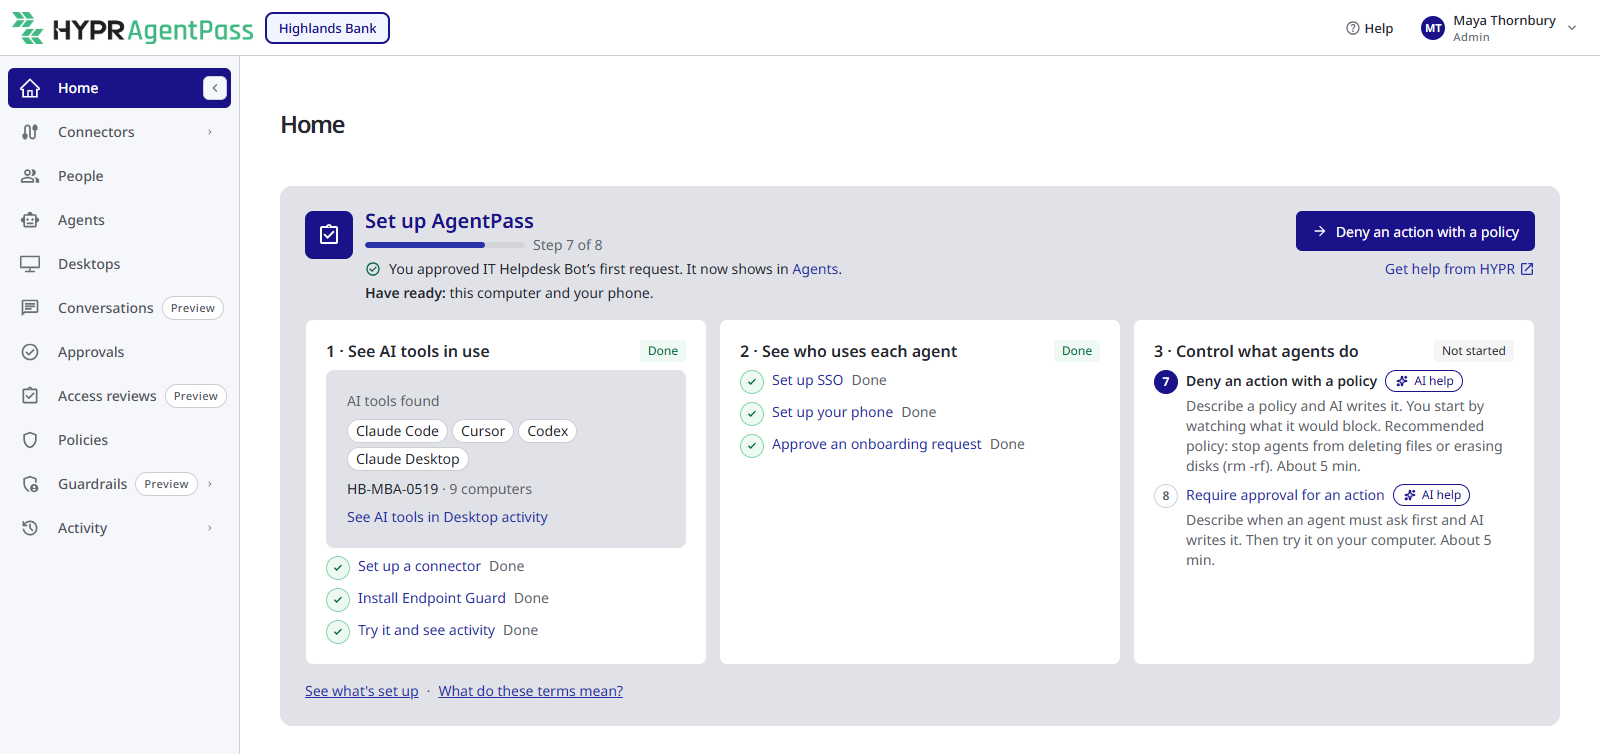
AgentPass ticks each step when it sees the result. You do not tick steps yourself.
| Card | Step | Ticked when |
|---|---|---|
| 1 · See AI tools in use | Set up a connector | An enabled Anthropic or OpenAI connector exists |
| Install Endpoint Guard | A desktop has reported to AgentPass | |
| Try it and see activity | A desktop has reported an AI tool | |
| 2 · See who uses each agent | Set up SSO | Single sign-on to the console is turned on |
| Set up your phone | You have a passkey that can approve requests | |
| Approve an onboarding request | An approval request has been approved | |
| 3 · Control what agents do | Deny an action with a policy | An enabled policy that denies an action exists |
| Require approval for an action | An enabled policy that requires approval exists, and a request it held has been approved |
To work through the guide:
- Click the button at the top of the guide, which names the next step, or click any step. The page for that step opens.
- Follow the bar above the page. It names the step and what to do. When the step is done, it names the next step.
- Return to Home to see your progress. Under the progress bar, the guide says what the last step set up, or what the open step is waiting for.
The guide updates by itself while it is open. A step that AgentPass cannot check reads Couldn't check this right now. Until a desktop or an agent has reported, the guide fills the page, and the rest of Home appears after step 2.
Two links at the bottom of the guide open side panels:
- See what's set up lists what HYPR set up for your organization, such as email and passkeys, and whether each is ready.
- What do these terms mean? explains the words the steps use.
When all eight steps are done, the guide reads AgentPass is ready. Click Hide this guide to remove it from Home. Hiding is personal, and applies in every browser you use. To show the guide again, click Help in the top bar, then Get AgentPass ready. See Help and Update Notices.
Recommended and Try AgentPass
Once the guide is done or hidden, two panels take its place:
- Recommended lists further setup: Sync your directory, Use your own email and AI and Add cloud agents. Click Set up to open the page for a row, or Not now to remove the row.
- Try AgentPass offers things to try: See what a session did, Chat with your agents, Enforce your policy and Review who has access. Once a cloud agent is active, it adds Stop a cloud agent from your phone. Click Try it on a card to open its page. Click the close button to remove the panel.
Tiles
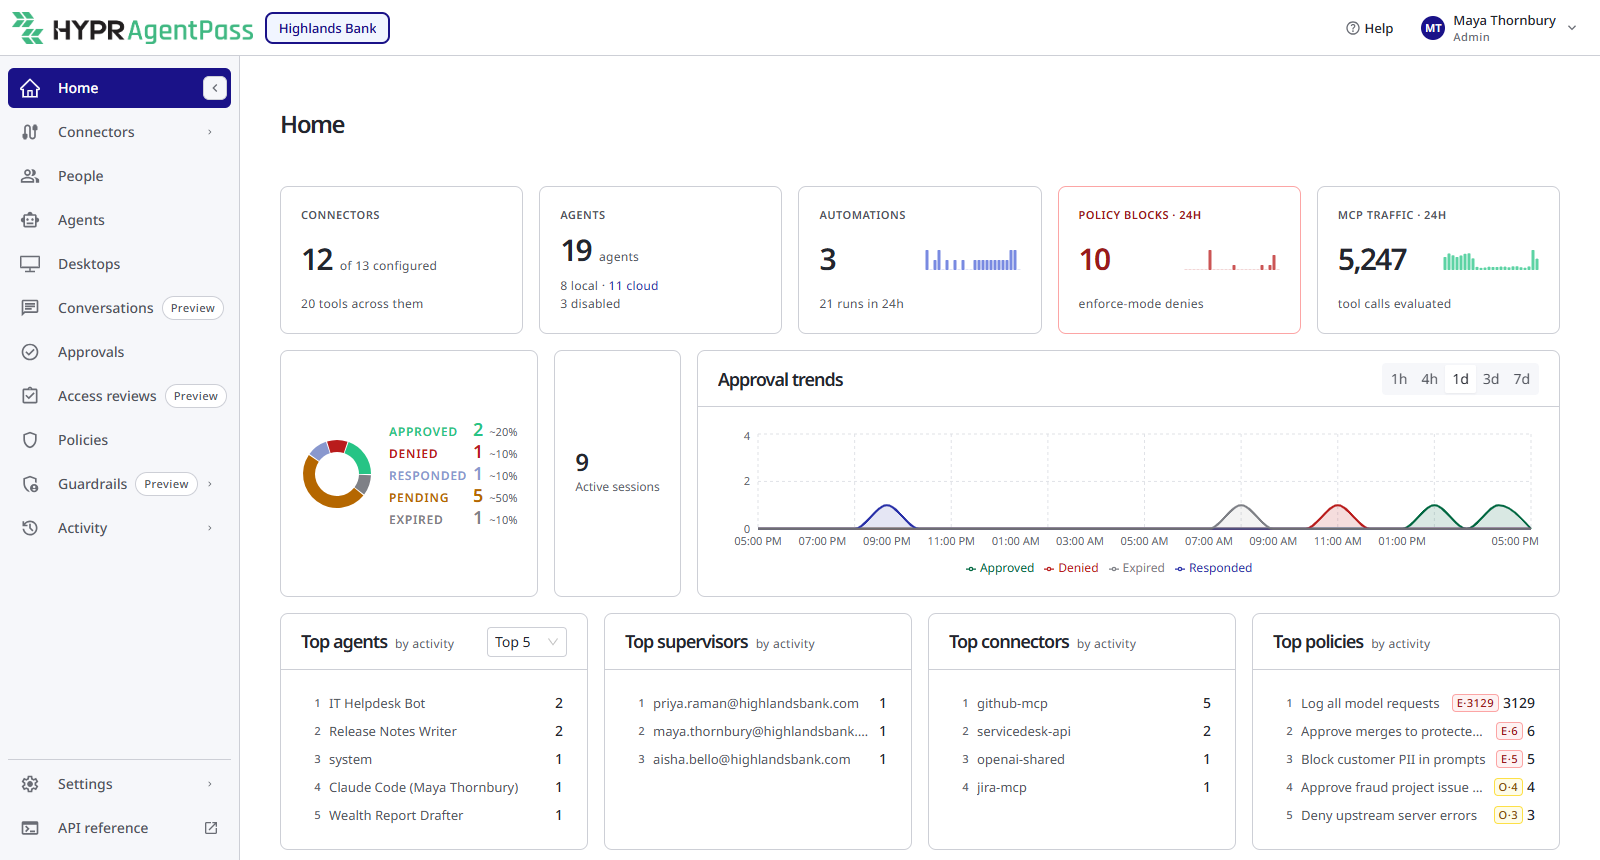
The tiles across the top summarize the gateway.
| Tile | Shows | Clicking it opens |
|---|---|---|
| Connectors | Enabled connectors out of those configured, and the tools they expose | Connectors. See Connectors |
| Agents | Every agent AgentPass governs, local and cloud, with how many are disabled or archived | Agents, filtered to Local agents. See Agents |
| Automations | Automations, and their runs in the last 24 hours | Agents. See Automating Cloud Agents |
| Policy Blocks · 24h | Requests a policy blocked in the last 24 hours | Connectors, where each connector's Policies tab lists its decisions. See Policies |
| MCP Traffic · 24h | Tool calls evaluated in the last 24 hours | Request log. See Request Log |
The Agents Tile
The large number counts every agent your organization governs: local and cloud agents of every kind, whether they are switched on or disabled. Archived agents are not included.
The two lines below it break the number down:
- Local and cloud. For example, 25 local · 16 cloud. Click the cloud count to open Agents filtered to Cloud agents. Click anywhere else on the tile to open it filtered to Local agents.
- Disabled and archived. For example, 3 disabled · 1 archived. A count of zero is left out, and the line reads All active when no agent is disabled or archived. Disabled includes agents held in a conflicted state.
What You See Depends on Your Role
The scope of your Request log: View permission decides what Home covers.
- All scope. Admin, Operator, Security analyst, Auditor and Model governance owner hold it. Home covers your whole organization.
- Own scope. Supervisor holds it. Home covers your own records:
- Tiles. Connectors and Policy Blocks · 24h are not shown. Agents counts the agents you created or supervise, and the agents assigned to you directly or through a group. Automations and MCP Traffic · 24h count your own.
- Approvals. The counts, the chart and the approvals panel cover requests from agents you supervise, and requests you answered.
- Active sessions. Counts the sessions of agents you supervise.
- Top lists. Top policies is not shown.
- What does it cost? The card is not shown.
See Permissions by Role.
Approvals
The approvals area shows what people have been asked to decide:
- The donut splits approval requests into Approved, Denied, Responded, Pending and Expired. Approved, Denied, Responded and Expired count requests resolved in the last 24 hours. Pending counts every request still waiting, whatever its age.
- Active sessions counts the agent sessions currently connected.
- Approval trends charts outcomes over 1h, 4h, 1d, 3d or 7d. The default is 1d. This selector changes the chart only.
- The approvals panel, at the bottom, lists requests for the selected period and outcome filter: All, Pending, Approved, Denied, Responded or Expired.
The approvals panel switches between a flow graph and a table. The flow graph is the default. It runs from agents to connectors, policies, supervisors and outcome. Hover over a path to highlight it. The graph draws the newest 100 approvals. When the period holds more, the title reads Approvals · Latest 100, and the line under it gives the total. A column with more than 12 entries shows its 10 busiest, plus a +N more node that lists the rest when you hover over it. Click Show all to expand every column, and Show top 10 to collapse them again. The live tag shows that the panel refreshes itself every 30 seconds.
To act on a request, or to revoke an approval already given, open Approvals.
Filter the Approvals Panel
Several controls narrow the approvals panel:
- The donut. Click a status, such as Denied, to show only that status. It clears every other filter.
- Active sessions. Click the card to return the panel to All, with no filters.
- The top lists. Click a row to show only that agent, supervisor, connector or policy. It clears the other filters. A policy row also sets the status to Denied.
- The column filters. Agents, Connectors, Policies and Supervisors each have a filter, in both views. Pick one or more values. The panel shows approvals that match any value you picked in a filter, and every filter you set. Each value shows how many approvals it has in the period. The filters apply to every approval in the period, not only to the 100 drawn.
- The status buttons. All, Pending, Approved, Denied, Responded or Expired.
- The time window. Past hour, Past 4h, Past day, Past 3 days or Past 7 days. The default is Past day.
A top-list click shows in its column filter. Reset filters returns every column filter to All, and collapses the graph to its top 10. The status and the time window stay. When nothing matches, the panel reads No approvals match these filters., with Reset filters beside it. Click the refresh button to fetch the latest requests.
Approvals Panel Columns
The panel lists up to the 100 most recent requests in the window, 30 to a page. In the table view, each row shows these columns.
| Column | What it shows |
|---|---|
| Time | How long ago the request was raised. Hover for the full timestamp |
| Status | Pending, approved, denied, responded or expired |
| Agent | The agent that made the request |
| Connector | The connector it was sent to |
| Request | The method, the path and the approval message |
| Type | Policy, Agent or Onboarding: what raised the approval |
| Supervisor | The supervisor asked to decide |
| Resolved | How long the decision took, or waiting while it is pending |
A shield icon at the end of a row marks a request that carries an action digest.
Approval Flow
Click a row in the table view to open Approval Flow. It is a read-only view of one approval. To decide or revoke, use the Approvals page. Only the table view opens Approval Flow.
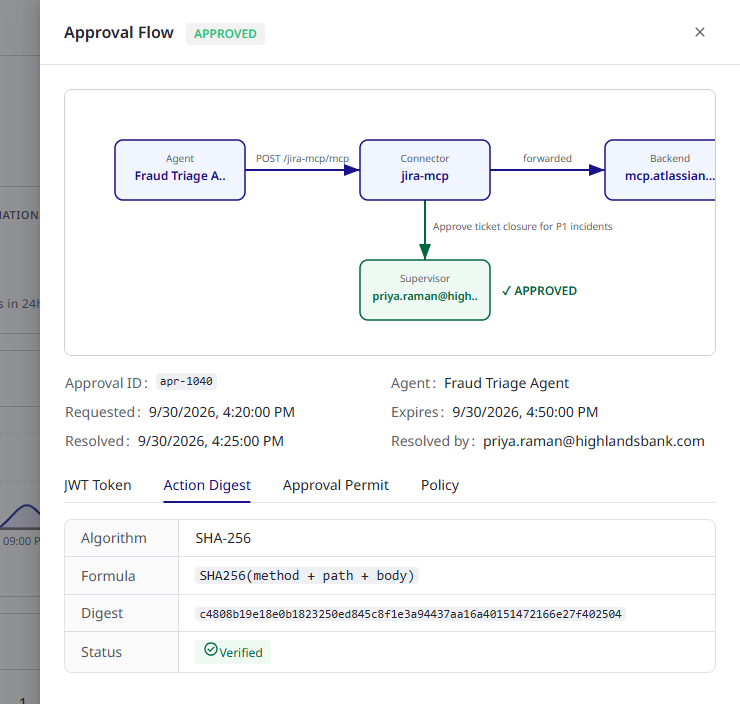
The drawer shows the approval's status and a diagram. The diagram traces the request from the agent through the connector to the backend, and to the supervisor asked to decide. The path to the backend is dimmed for a denied or pending request.
The summary lists the Approval ID, Agent, Requested and Expires fields, plus Resolved and Resolved by once the request is resolved.
The drawer's tabs hold the records behind the approval. A tab with nothing to show is disabled.
| Tab | Shows |
|---|---|
| JWT Token | The claims in the agent's token |
| Action Digest | The digest of the action the agent asked to perform, and how it is computed from the method, path and body |
| Approval Permit | For an approved request, the supervisor, the decision, when it was made and any comment |
| Policy | The policy that raised the approval, its type and message, the request and the connector |
Top Lists
Top agents, Top supervisors, Top connectors and Top policies always cover the last 24 hours. The period on the chart or the approvals panel does not change them. The selector on Top agents, from Top 5 to Top 50, sets how many rows every list shows.
- Top agents and Top connectors rank by the approval requests raised.
- Top supervisors ranks by the requests each supervisor approved or denied.
- Top policies ranks by matches. A policy's row shows its enforce matches (E·n) and observe matches (O·n), where there are any, then its total.
Click a row to filter the approvals panel. See Filter the Approvals Panel. To see what no policy reaches, open Policy Coverage.
What Does It Cost?
Under the top lists, What does it cost? shows your organization's model spend this week, at your model prices. It shows the total, the spend per active person, and under By team the three user groups whose members spent the most. A person in two groups counts in both.
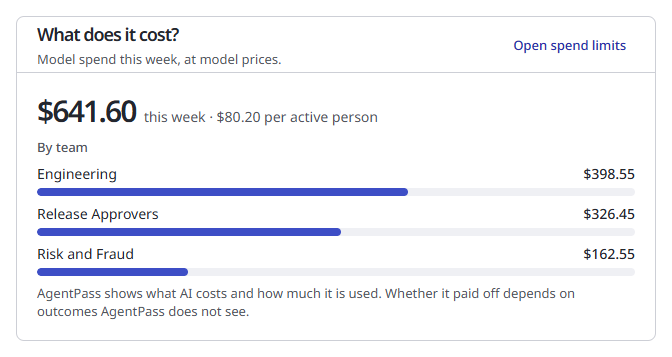
Open spend limits opens the Spend limits tab of Policies. Until your organization has a spend limit, the card suggests one, with Set a spend limit. See Daily Spend Limits.
Related
- Approvals — decide, review and revoke requests
- Agent Session Forensics — open what one active session did
- Data Management — what feeds Home, and for how long
- Request Log — the inference and MCP tool traffic behind the MCP Traffic · 24h tile