Data Management
HYPR AgentPass™ records the agent traffic that flows through the gateway. That record covers the requests and responses your agents exchange with LLM providers and MCP tools, the policy decisions taken on them, and the administrative changes made around them.
The Data management page shows that record in full: every event AgentPass emits, the attributes each one carries, where those events are sent, and how long they are kept. It answers three questions, and keeps them separate because they have different answers:
- What is recorded: the event catalog. Every event type, its attributes, and which of them identify a person.
- Where it goes: the destinations each category of event is sent to.
- How it leaves: per attribute, whether it is sent as clear text, hashed or not sent at all.
You need Data retention: View to open the page, which Admin, Operator and Auditor hold. Changing the configuration needs Data retention: Manage, which only Admin holds. See Permissions.
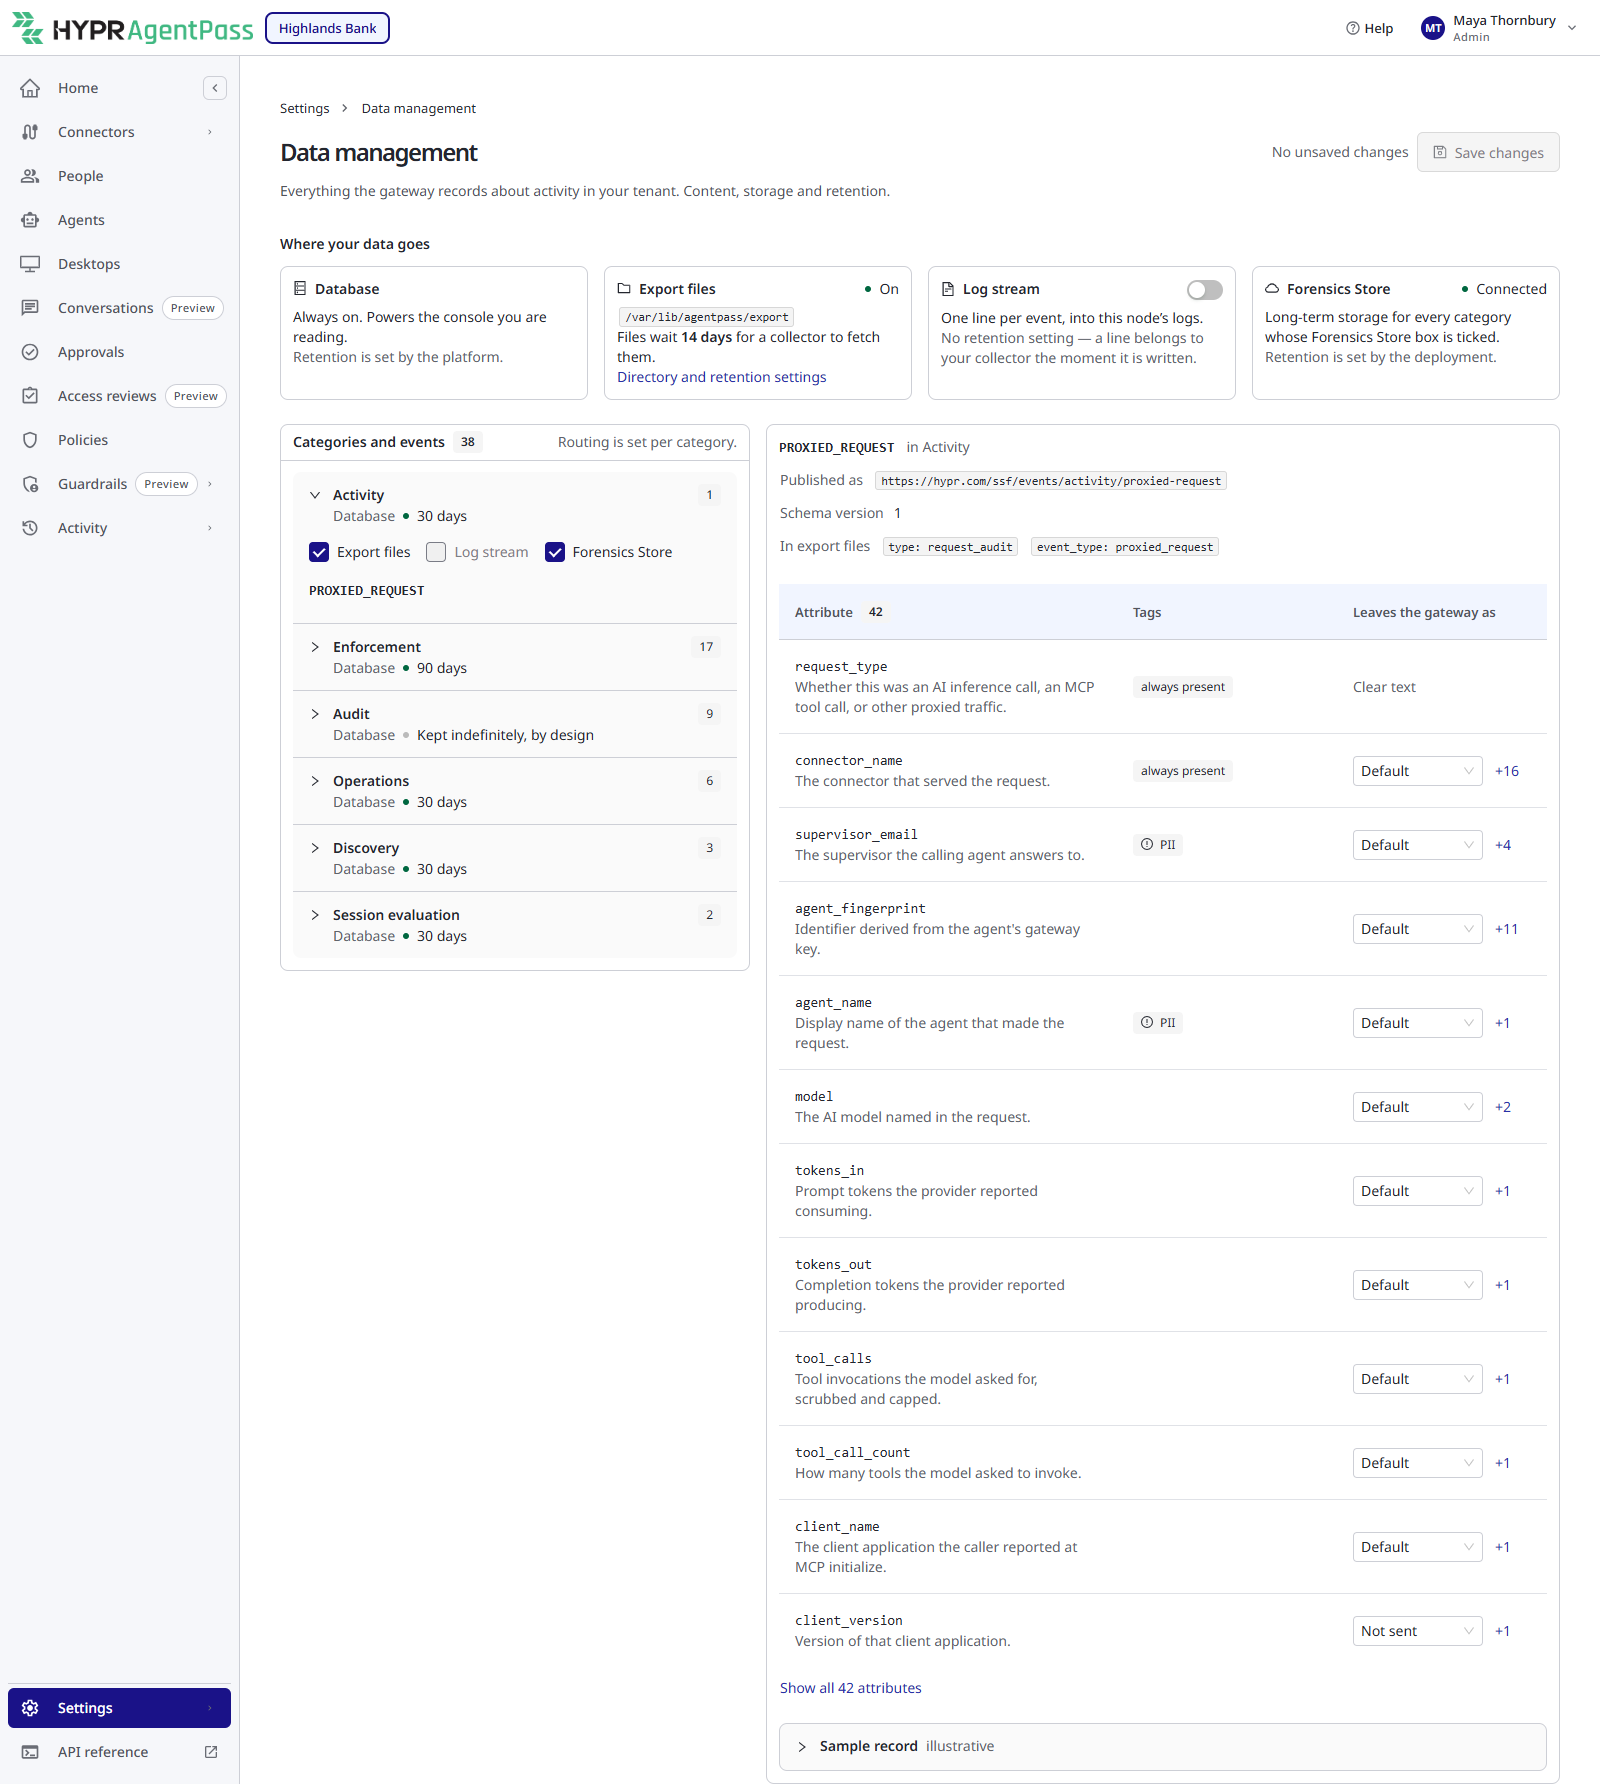
Where Your Data Goes
Open Settings › Data management. The strip across the top of the page names the four destinations, and shows their current state.
| Destination | What it is | Retention |
|---|---|---|
| Database | The store behind the Request log, the agent Activity tab, Desktop activity and the connector request views. Always on | Set by the platform, per category. See Categories and Events |
| Export files | JSON Lines files written on each gateway node. A write-only export for your own compliance or analytics store | A window you set: how long a file waits to be collected |
| Log stream | One line per event in the gateway's logs, for deployments that already collect container logs | None. See Log stream |
| Forensics Store | Long-term storage for your organization's events, when your deployment has one connected. See Forensics Store | Set by your deployment |
Each destination follows its own schedule, so no single retention figure appears on this page. The log stream has no retention setting. A line belongs to your collector once it is written.
The database cannot be turned off. The console is built from it. The retention window shown against each category bounds it.
Export Files
Export files are JSON Lines files written on each gateway node, one file per organization per UTC hour. AgentPass never reads these files back, and the console cannot display them. They exist for you to ship into your own systems. The Export files card shows whether they are On or Off.
To turn them on, you need Data retention: Manage:
- On the Export files card, click Directory and retention settings.
- Select Write export files on each gateway node.
- Click Save changes.
The same panel holds the export settings:
- Directory is where the files are written on each gateway node. Leave it blank to use the directory configured when the gateway was deployed. The directory must already exist on every node, because AgentPass does not create it.
- Keep files for is how many days a file waits for a collector to fetch it, from 1 to 365. The default is 14. This is the one retention number on the page you can change. It is not a window on the data itself. Deleting a file a collector has not yet fetched would destroy the only copy, so this clock belongs to your collector, not the record.
- Write test writes a server-generated test line to the target directory. The page reports the file it wrote, or why the test write failed. Use it to verify the destination before you save.
Inside the directory, each organization's files sit in a folder named for its organization ID. Each file name carries the hour and the node that wrote it, so nodes that share a volume never write to the same file.
Each run of records in a file ends with a footer line, {"shard_footer": {...}}, that is not an event. It carries the node, the record count and the sequence range the run covered. Have your collector skip it, or use it to check that no records are missing.
Each gateway node writes its own files. Collecting them, with a mounted volume or a log shipper for example, is a task for your deployment team.
When Export Files Stop Being Written
When a gateway node cannot write its export files, a banner reads Event export files are not being written. It appears on this page and on the Request Log, for anyone who holds Data retention: View. The banner names the cause, such as a directory the gateway could not create or a file it could not write. It also gives the number of failed writes, how many nodes are affected and when the failures started.
Records still reach the database while the banner shows, so the console stays complete. The export files for the same period are missing records. Check the export directory on the affected nodes, including its free disk space and write permissions.
The banner clears once the node writes its export files again.
Log Stream
Turn on Log stream to write one line per event in the gateway's logs. Each line is the complete event, in the same format the export files use. Anything that already collects your container logs can consume it, with no volume or cleanup job.
If you turn on both Export files and Log stream, events routed to both are recorded twice. This suits a setup such as files for a SIEM and logs for a cloud collector. The Log stream card tells you how many categories are affected.
Send the Request Log to Your SIEM
The Request Log's records are Activity events. To send them to your SIEM through the log stream:
You need Data retention: Manage, which only Admin holds.
- Open Settings › Data management.
- On the Log stream card, turn on the switch.
- Expand the Activity category, and check that its Log stream box is selected. A category routes to the log stream once the stream is on, unless its box was cleared. Select Log stream for any other category your SIEM needs, such as Enforcement for policy decisions.
- Click Save changes. The header reads No unsaved changes.
- Send a request through the gateway. In the system that collects your gateway's container logs, such as an Amazon CloudWatch Logs log group, find its event by its
client_iporagent_session_idvalue. - Check that the same event reaches your SIEM, such as Splunk.
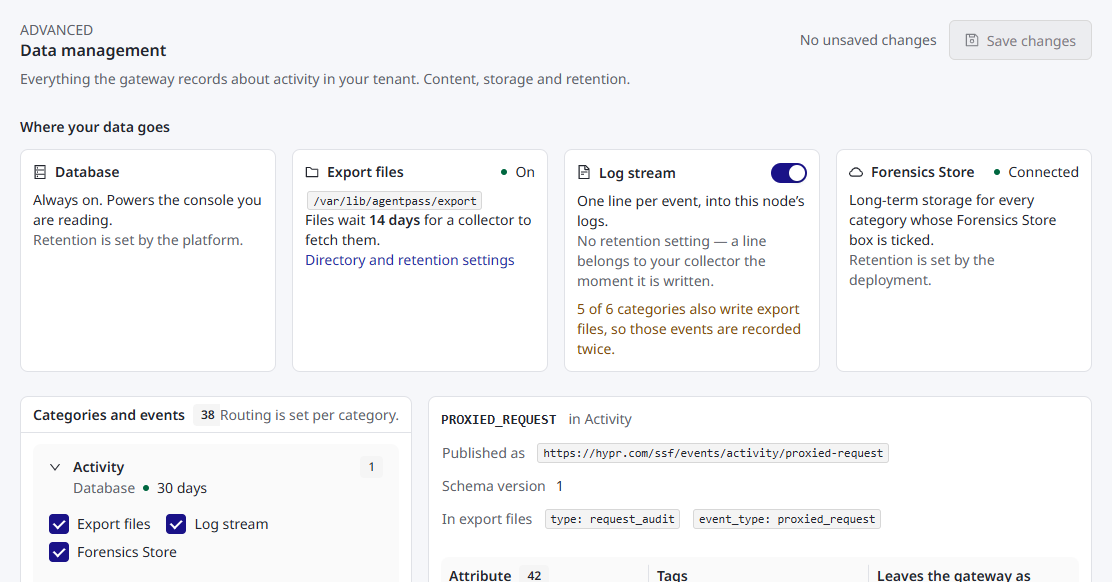
Each event arrives as one line. An abridged PROXIED_REQUEST event, shown across several lines, looks like this:
{
  "category": "activity",
  "client_ip": "203.0.113.7",
  "event_type": "proxied_request",
  "event_uri": "https://hypr.com/ssf/events/activity/proxied-request",
  "iss": "https://gateway.example.com",
  "jti": "01JQ7XAE9KMNPQRSTVWXYZ0001",
  "payload": {
    "agent_session_id": "9f1c2e7a-4b1d-4e2a-9c3b-5d6e7f809a1b",
    "client_name": "Claude Code",
    "connector_name": "anthropic",
    "forwarded_for": "198.51.100.9, 203.0.113.7",
    "http_status": 200,
    "model": "claude-sonnet-4-5",
    "request_type": "INFERENCE",
    "supervisor_email": "kmPeN6q3oKopRzadSJ1Zk-FxsTffZ6fpb7j7rAundwg"
  },
  "txn": "01JQ7XAE9KMNPQRSTVWXYZ0009",
  "type": "request_audit"
}
To open the requests behind a SIEM alert, link to the Request Log with the event's values. See Link to a Search.
What an Exported Event Carries
Events sent to the export files, the log stream and the Forensics Store carry these values for correlation:
| Field | On | What it holds |
|---|---|---|
client_ip | Every event a request causes | The request's source IP. See Where the Source IP Comes From |
txn | Every event a request causes | The transaction ID that ties one request's events together |
agent_session_id | PROXIED_REQUEST | The coding session the request belongs to, when the agent reported one |
forwarded_for | PROXIED_REQUEST | The X-Forwarded-For chain as the gateway received it, up to 512 characters |
An event that no request caused, such as one from a scheduled job, carries no client_ip or txn.
agent_session_id and forwarded_for are attributes, so each follows its Leaves the gateway as setting. Both leave as clear text by default. The Request Log searches by the recorded value, so a value that leaves Hashed cannot be pasted into its search.
Forensics Store
The Forensics Store keeps your organization's events for the long term. Your deployment decides whether one is connected, and how long it keeps records. When one is connected, its card reads Connected. When none is, the card says so, and no records are sent there.
When a Forensics Store is connected:
- Every category is sent to it by default. Clear a category's Forensics Store box to stop sending that category.
- It can keep what the console shows. An attribute left at Default can be kept as clear text there, so its records match the console. See Leaves the gateway as.
- It can keep whole bodies. The database keeps only the first part of a very large request or response body. When your deployment keeps whole bodies, the Request Log can fetch the whole body when you ask. See When a Body Was Cut Short.
Whole bodies are kept only while the Activity category is sent to the Forensics Store. For the PROXIED_REQUEST event, arguments_summary governs the request body and response_body the response body. A whole body is kept only while its attribute leaves as Clear text there.
Categories and Events
Events are grouped into six categories. A category decides two things: how long its events are kept in the database, and which destinations they are sent to.
| Category | What it records | Kept in the database |
|---|---|---|
| Activity | Requests your agents made through the gateway | 30 days |
| Enforcement | Policy decisions, access denials and the approval workflow | 90 days |
| Discovery | AI tools and SaaS usage observed across your estate. Desktop activity keeps what desktops report for this window | 30 days |
| Audit | Administrative changes: Data management and platform retention settings, policy mode changes, successful directory provisioning changes and access reviews. Also export-file failures and recoveries. See Reading the Audit Trail | Kept indefinitely, by design |
| Operations | What the gateway did to keep a connector working, and the directory sync requests from your identity provider | 30 days |
| Session evaluation | The session digests Session Watch sends its evaluator agents, and their replies | 30 days |
Your organization does not set database retention. Each category in the tree shows its window, such as 30 days, marked · set by the platform. Audit records are never dropped.
Expand a category to route it. Each destination has its own checkbox. The Log stream checkbox stays disabled while the log stream is off. Hover over it to see where to turn the log stream on. The Forensics Store checkbox is selected by default when your deployment has one connected.
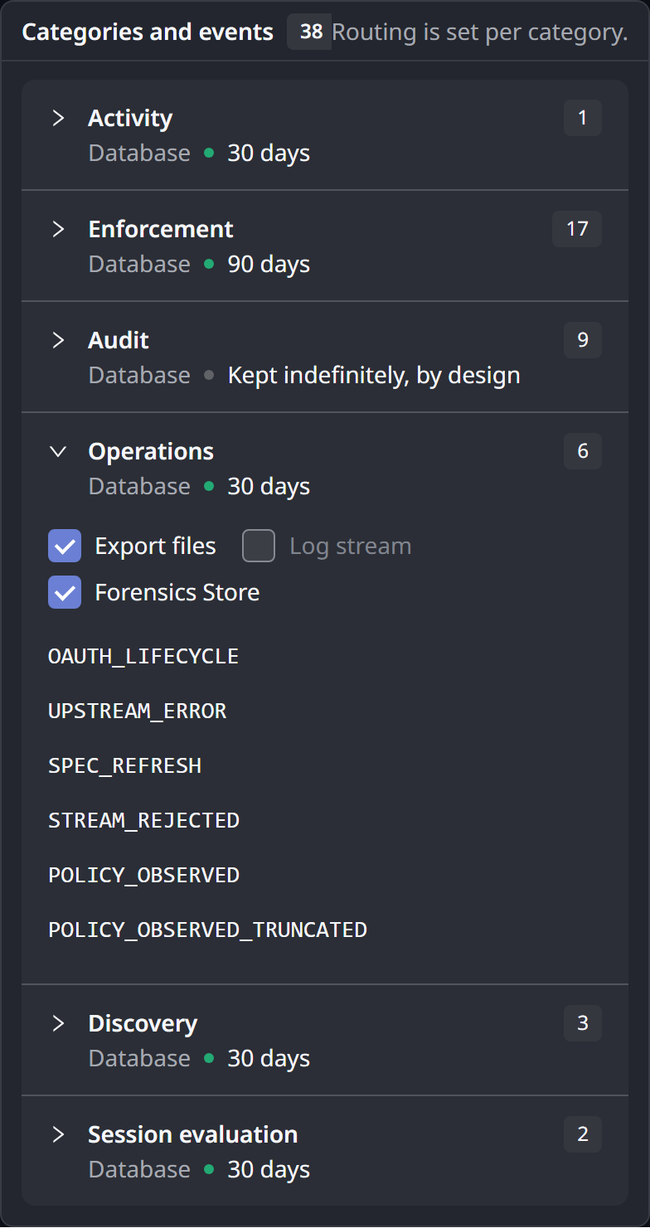
What an Event Carries
Click an event type to see what it records:
- Published as: the event's identifier
- Schema version: the version of its record
- In export files: the
typeandevent_typevalues the event carries in the export files - The attributes it carries. Click Show all to list every attribute
- Sample record · illustrative: an example of the record a destination receives. Copy sample record copies it
Each attribute shows what it holds. Its Tags column marks whether it is always present, and whether it is tagged PII. The PII tag marks an attribute that identifies a person directly, such as an email address or a login name. It is not a judgment about user content. An attribute that may contain anything a user typed says so through its treatment instead.
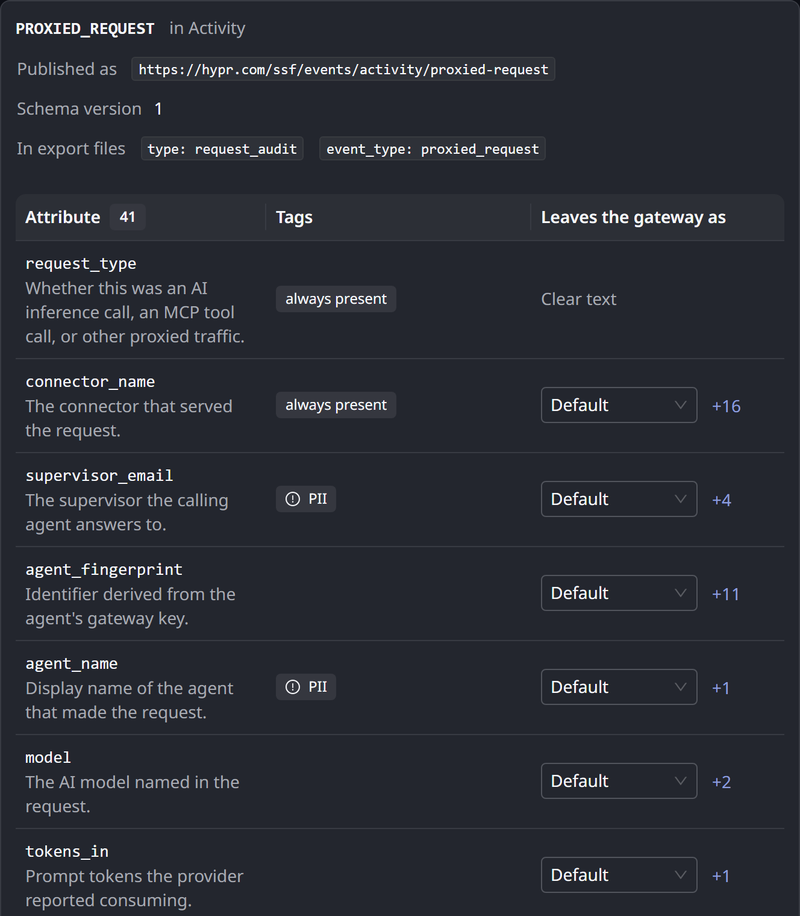
Leaves the gateway as
Each attribute has one setting, which governs every destination outside the database.
| Setting | What it does |
|---|---|
| Default | No choice of your own. Each destination applies its own default for the attribute |
| Clear text | The attribute is sent as recorded |
| Hashed | The attribute is replaced by a one-way digest. The same input always produces the same digest, so records can still be correlated without carrying the value |
| Not sent | The attribute is omitted entirely |
Every attribute starts at Default. The export files and the log stream then apply the setting AgentPass gives the attribute. The Forensics Store can keep the attribute as clear text instead, so that its records match what the console shows. Hover over Default to see what each destination applies.
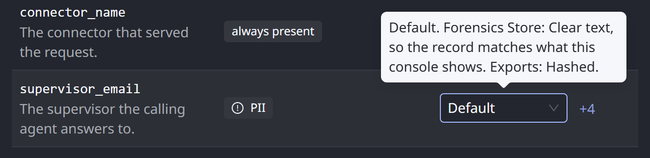
Choosing any other setting stores your choice, even one that matches a default, and it then applies to every destination. Choose Default to remove it.
This setting does not affect the database. The database holds what the gateway saw, for the category's retention window. Not sent means the attribute does not leave the gateway. It is still recorded in the database.
An attribute that is always present cannot be Not sent, because there is nowhere to put an absent value. Only text attributes can be Hashed. Where a choice does not exist, the page states the setting, instead of offering a control that would be refused.
Changing a setting governs what is written from that point on. Records already written to a destination are not changed.
Applying One Attribute Everywhere
The same attribute name often appears on several event types. When it does, the row offers to apply your choice to every event type that carries it, and says how many that is. "Hash supervisor email everywhere" is therefore a single action.
The count is the number of event types that carry the attribute today. An event type added in a later release starts from its own default, which is the safe one.
Save Your Changes
Changes on this page apply when you save them. While a change is pending, the page header reads Unsaved changes. Click Save changes to apply them.
The page confirms that the data management configuration was saved, and the header reads No unsaved changes. Saving needs Data retention: Manage. See Permissions.
Defaults
Until you change anything, every attribute is set to Default:
- In the export files and the log stream, every attribute tagged PII leaves the gateway Hashed.
- Attributes that carry user content, such as request and response bodies and tool-call arguments, are Not sent there.
- Everything else leaves as Clear text.
- The Forensics Store can keep attributes as clear text. Hover over Default to see what it applies.
- Events are written to the database, and to the Forensics Store when your deployment has one connected. Export files and the log stream are off.
AgentPass sets these defaults per attribute, not your organization, so a newly added event carries a safe setting before anyone configures it. You can loosen or tighten any of them.
Platform Retention Limit
Platform administrators set the platform retention limit. On the control plane, open Platform Data, and set the Default retention limit, from 1 to 365 days. The default is 90.
Editing the platform limit is a control-plane task for platform administrators, who need permission to manage organizations across the platform. Organization administrators never see this screen.
Permissions
Data management has its own permissions, separate from the general settings permissions.
| Capability | Permission | Built-in roles |
|---|---|---|
| See the Data management page and read the configuration, including the event catalog | Data retention: View | Admin, Operator and Auditor |
| Change and save the configuration, and test the export destination | Data retention: Manage | Admin |
A role that holds neither sees no Data management entry in the navigation. Permission to edit gateway settings does not grant access to this control. Platform-administration permissions govern the platform retention limit. See Permissions by Role.
Related
- Request Log — the record this page governs, for every role that can open it
- Viewing the Request Log — the supervisor's view of the same record
- Agent Session Forensics: Overview — how a coding session is reconstructed from these events
- Long-Term Audit and Telemetry — keep a copy of this record in your own store, and read the audit trail