Viewing the Request Log
The Request Log in the administration console shows what your agents sent through HYPR AgentPass™: every inference call to a language model, and every MCP tool call. Each is attributed to the agent that made it, and to you as its supervisor.
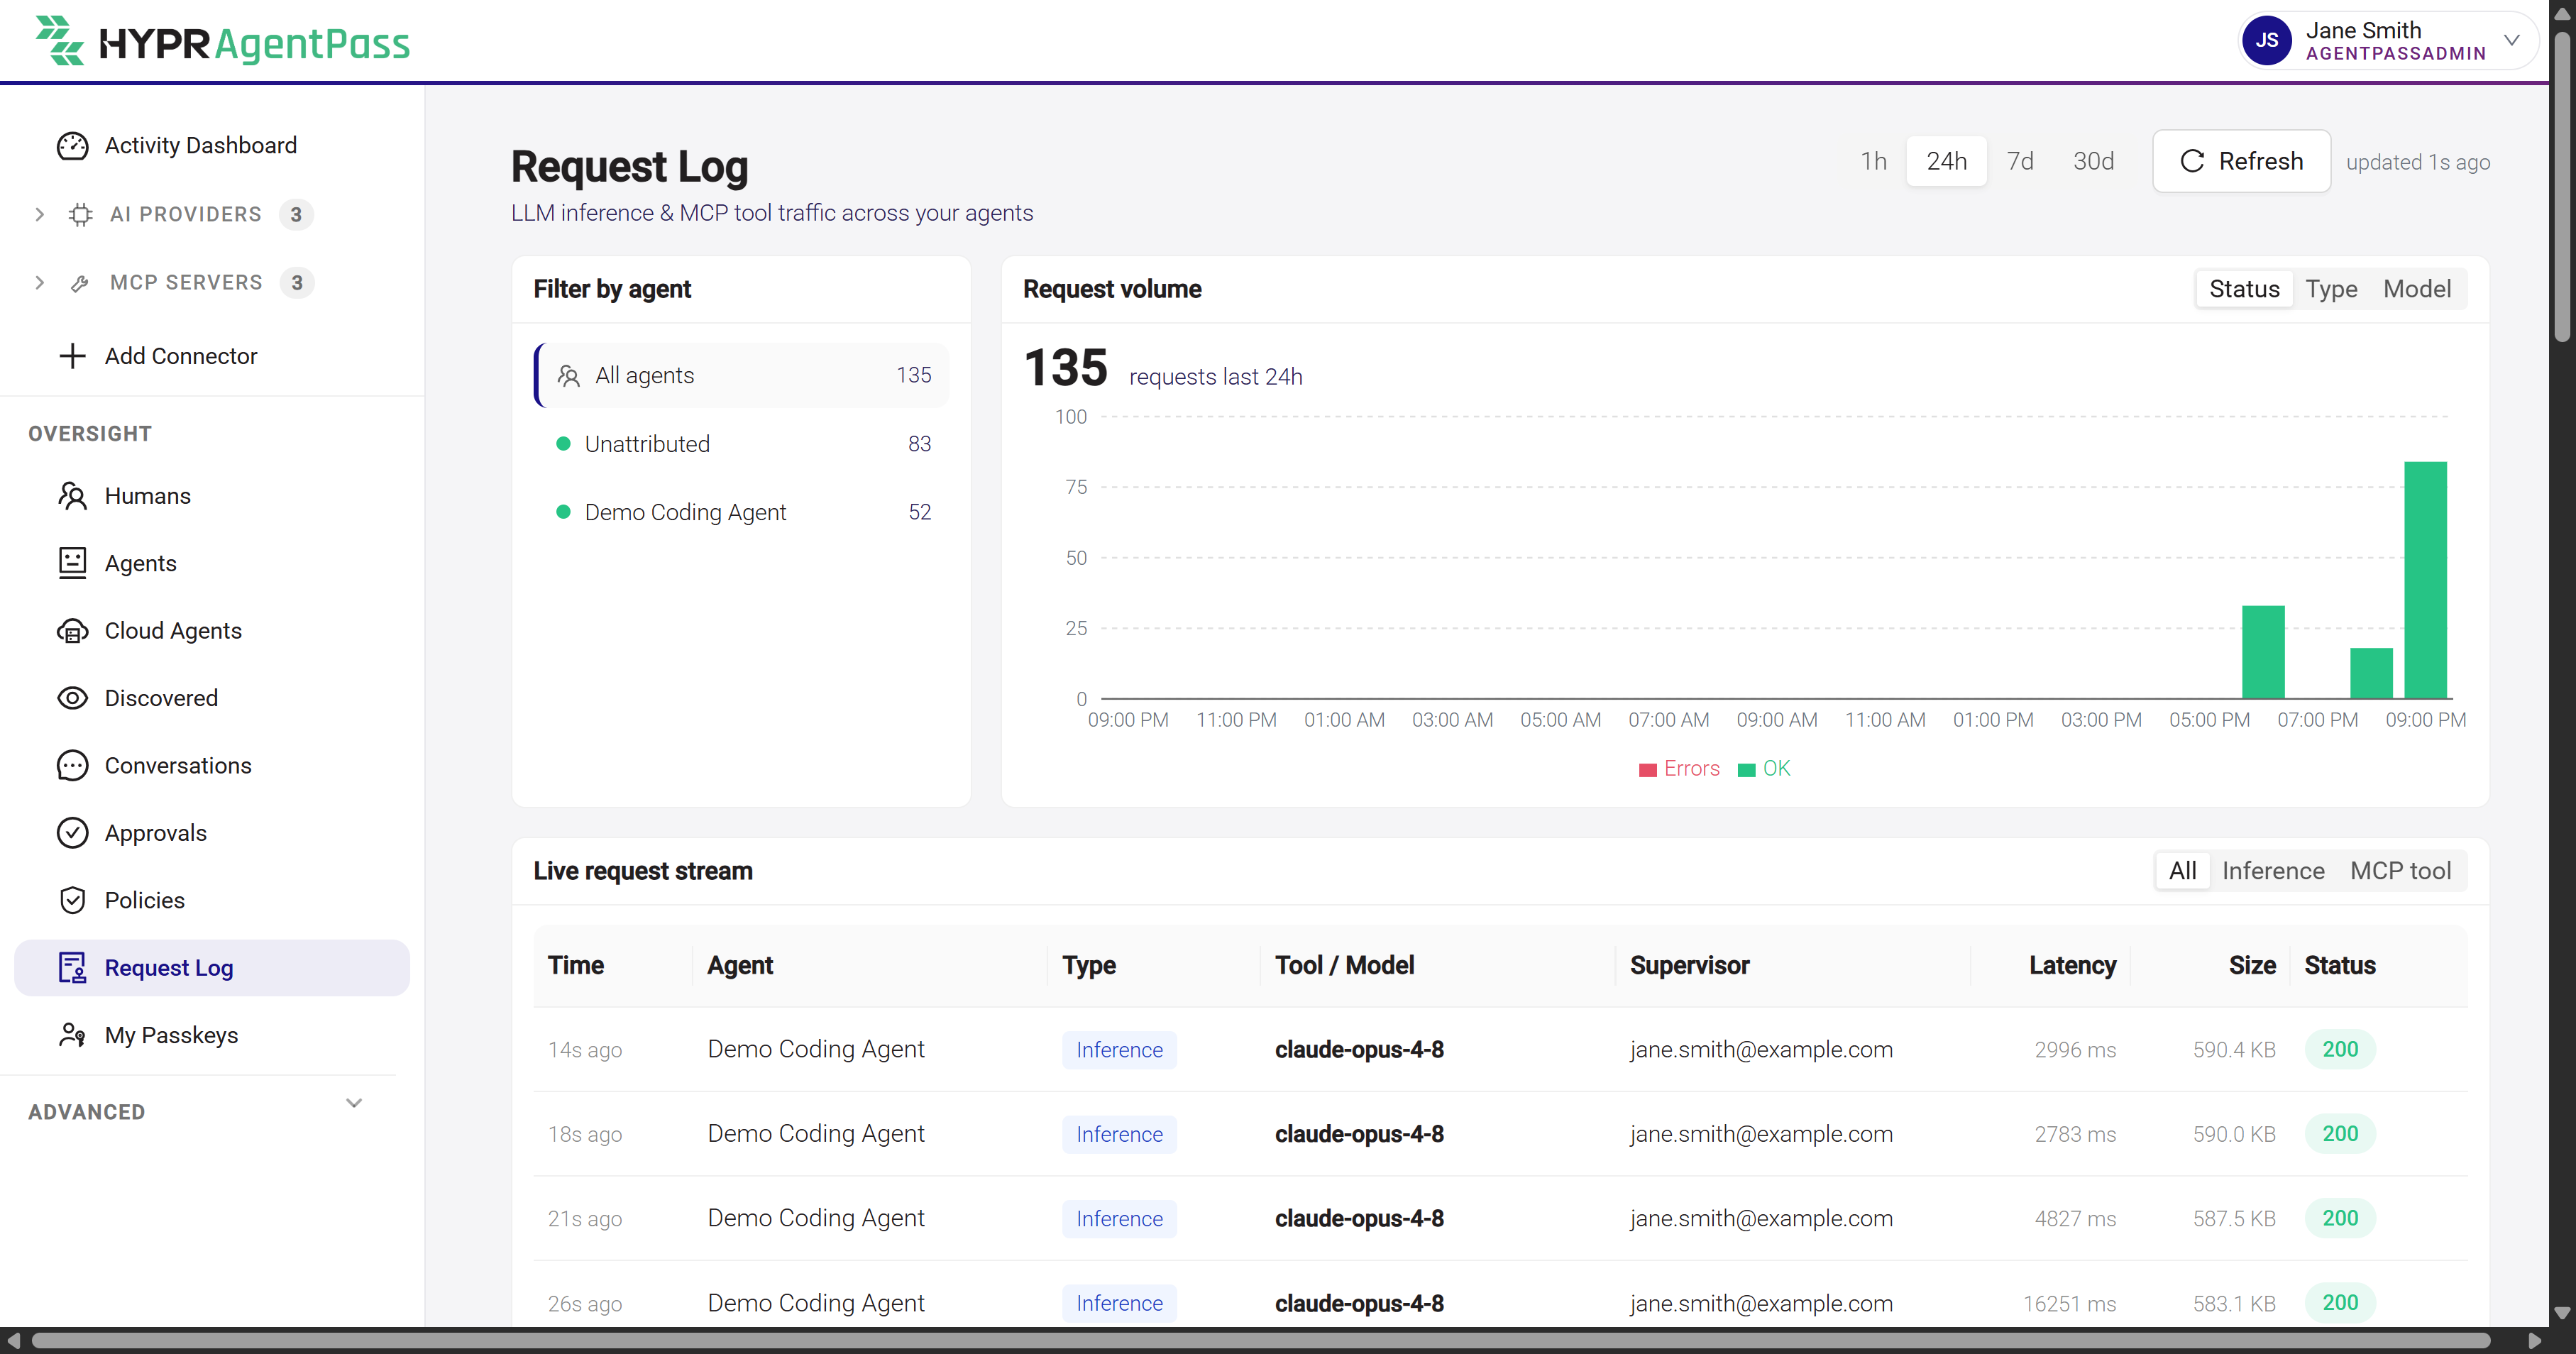
The time range reaches back up to 7 days. The platform sets how long each category of event is kept. See Data Management. The log shows what the gateway recorded. The settings that control how an attribute leaves the gateway apply to exports, not to the record the console reads.
Read the Page
Open Oversight → Request Log. The page has these parts:
- Time range. 1h, 24h or 7d sets the window for the whole page. Refresh pulls the latest activity.
- Summary cards. The success rate, request count, tokens, average latency and active agents for the time range. Hover over a card for its breakdown.
- Request volume. Total requests over the window, plotted over time, with successes and errors shown separately. Switch the view between Requests and Models.
- Request stream. Individual requests, newest first, with their status, time, agent, model or MCP tool, data classification, supervisor, latency, size and tokens. Narrow it with the All, Inference and MCP tool tabs. Load more extends the list.
You see the requests of the agents you supervise. Administrators and operators see every supervisor's requests, with more filters. See Request Log.
Inspect a Single Request
Click a row to open Request detail.
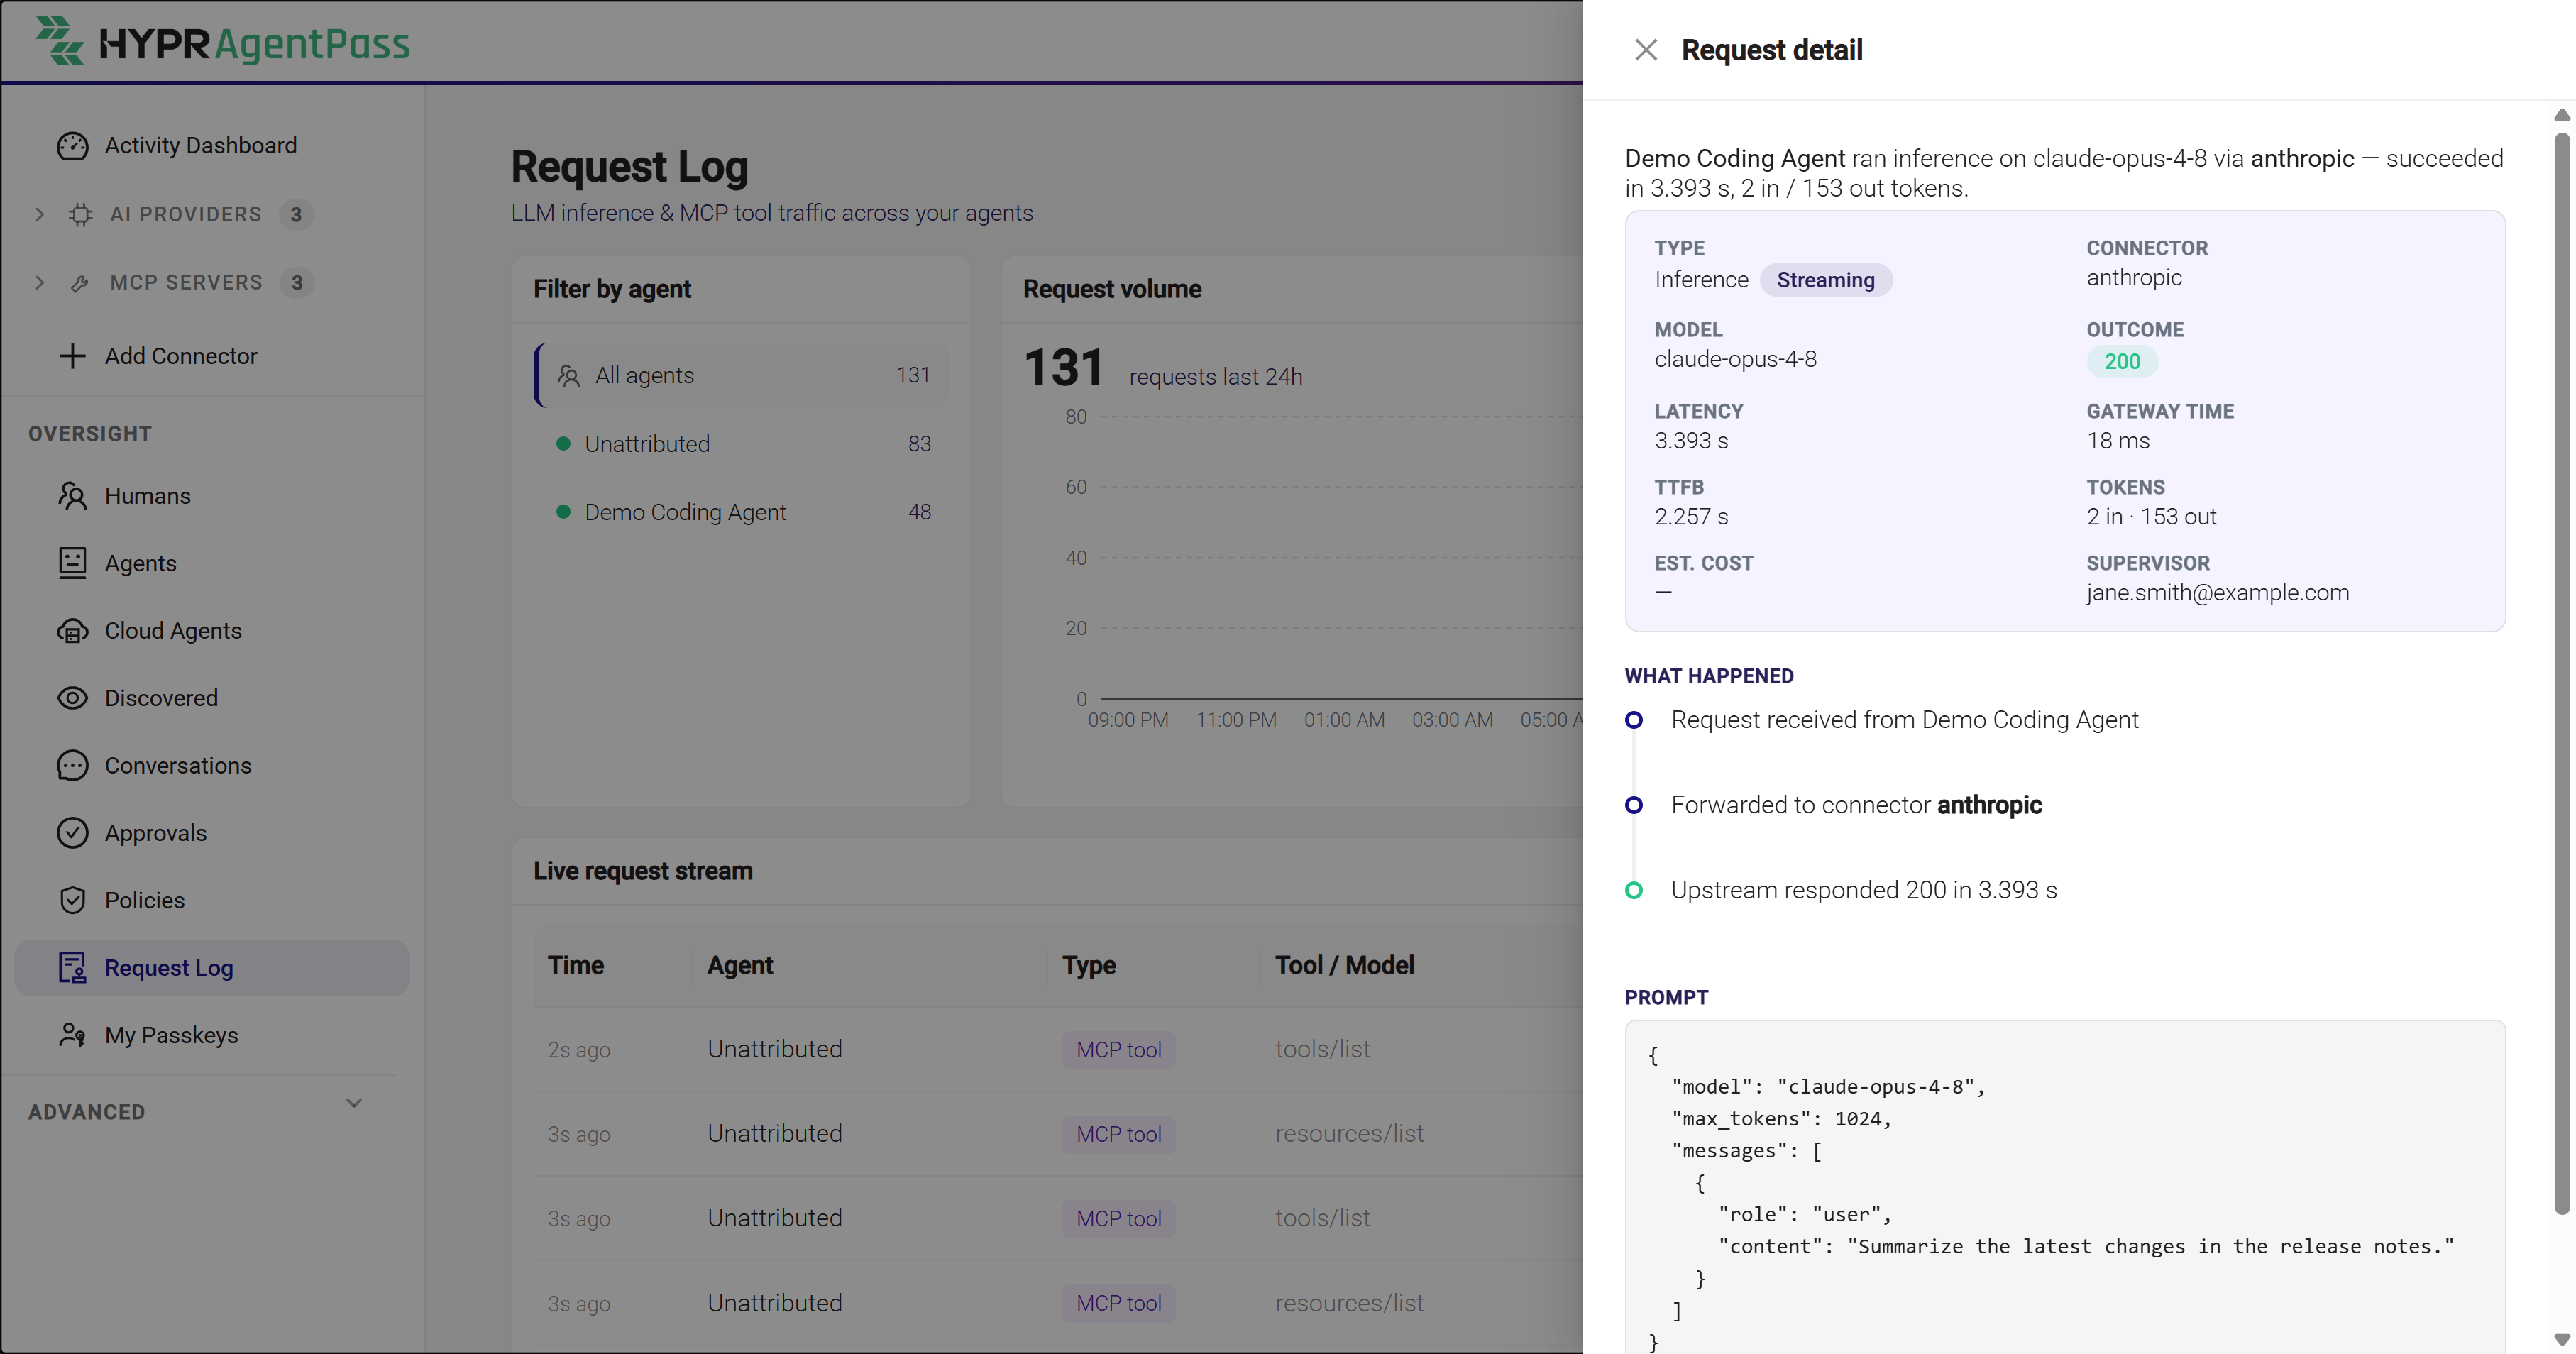
The panel opens with a one-line summary: which agent ran what, through which connector, and how it ended. It then shows these parts:
- Key facts. Latency, time to first byte, gateway time, tokens and payload size.
- What happened. A timeline of the request through the gateway.
- Data classification. The tier and tags the call carried, as classified when it was made. Later label changes do not rewrite the row. See Classifying the Data Your Tools Handle.
- Session before this call. What the call's session had already read, when session tracking identified it. See Governing What a Session Has Already Read.
- Tool calls. The tools the model asked to run, with each call's arguments, when there were any.
- Request and Response. The headers and body of each, as the gateway captured them.
An MCP tool call also shows Tool arguments, the arguments the tool was called with. An inference call whose request body was not captured shows a Request summary instead.
Two more fields appear when they apply:
- Coding session. For a request from a coding agent that reported a session, See everything this session did opens the whole conversation the request belongs to. See Agent Session Forensics.
- Bedrock caller. For a request to AWS Bedrock, the AWS identity behind the call. See Connecting AWS Bedrock.
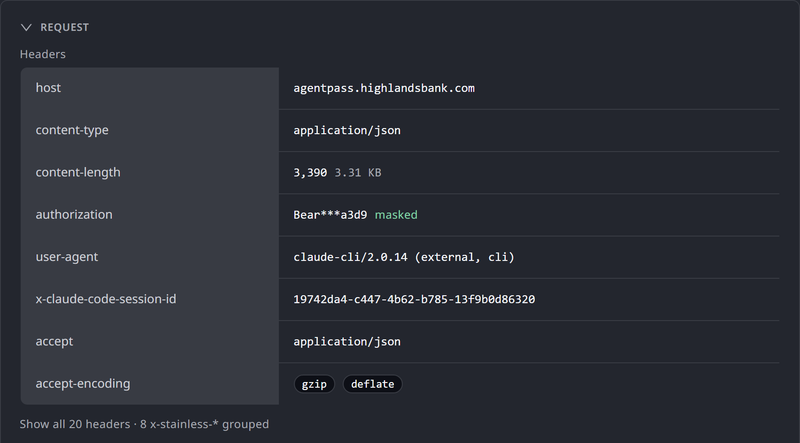
Headers
Each header shows on its own row. Values the gateway redacted carry a masked tag, so you can tell a hidden value from an empty one. A content length shows both the exact byte count and a readable size. Headers that hold a list show each item separately.
The headers you read most appear first. The rest, including runs of headers from the same vendor, are folded away. Click Show all to list every header, and Show fewer headers to fold them again. A header list or body that reads (not retained) was not captured.
Body Views
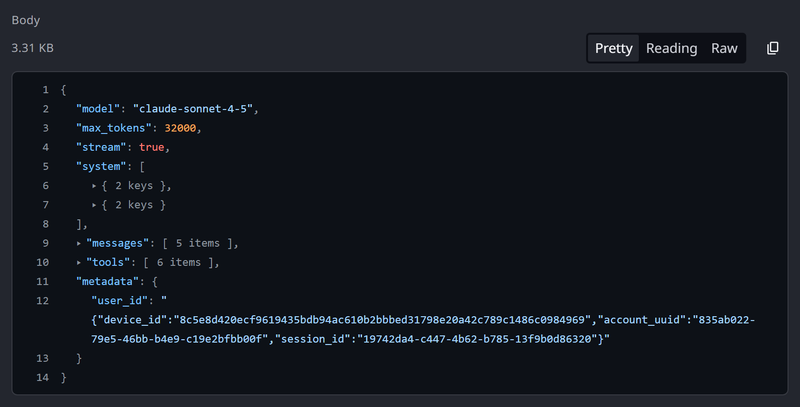
A body can be read in up to three views. Switch between them with the control beside the body's size.
| View | Shows | Offered |
|---|---|---|
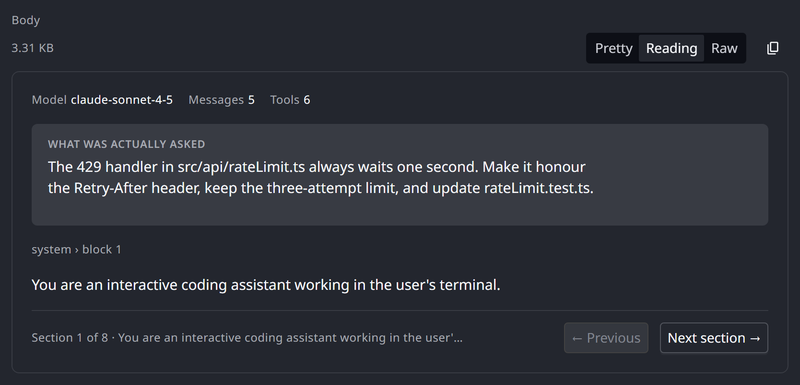
| Reading | The conversation as sections you page through | For recognized conversation formats, such as Claude Code and Codex traffic |
| Pretty | The body as an expandable structure | For JSON bodies |
| Raw | The captured text, exactly as stored | Always |
When Reading is offered, the body opens in it. The copy button always copies the raw captured text, whichever view is showing.
The Reading View
The Reading view turns a captured conversation into something you can read in order:
- A strip at the start shows what the body records about the call, such as the model, the token counts and the stop reason.
- What was actually asked shows the latest prompt in the conversation.
- The rest of the conversation follows one section at a time: messages, tool calls, tool results and reasoning summaries. Move through it with Previous and Next section.
When the view leaves something out, a note says what, and tells you to switch to Pretty to see everything that was captured. Links and images inside captured content are not active.
When a Body Was Cut Short
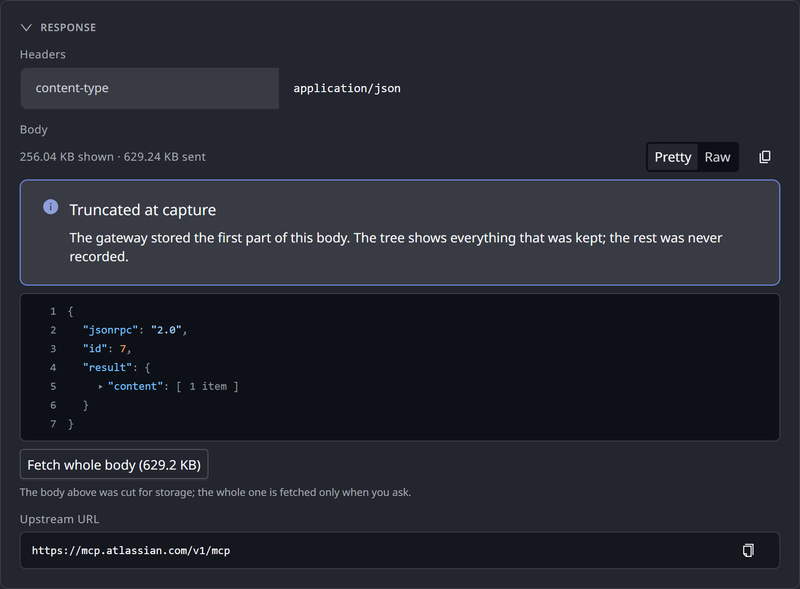
The gateway keeps the first part of a very large body. When it did, the size line reads as the size shown, then the size sent. A JSON body also shows Truncated at capture, and the Reading view ends with a note that the rest was not stored. Everything shown is what the gateway kept.
When your deployment keeps whole bodies in the Forensics Store, Fetch whole body follows a cut body, with the body's full size. Click it to load the whole body, under Whole body. Nothing is fetched until you click. Anyone who can open the request can fetch it.
If the button reads Not available, the whole body was not kept for this request, or has passed its retention window.
What the Provider Returned
The Response section also shows what happened between the gateway and the provider or tool behind the connector:
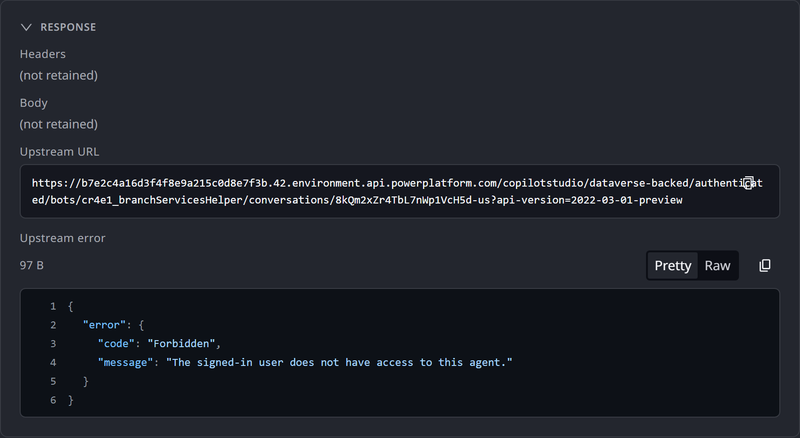
- Upstream URL. Where the gateway sent the call. You can copy it.
- Upstream status. Shown only when the upstream returned a different status from the one the gateway returned to the agent. It reads as the status returned, then the status the upstream returned. A different status means the upstream refused the call.
- Upstream error. The error the upstream sent back, when it differs from the response body shown.
- Provider request ID. The provider's own identifier for the call, when it returned one. Quote it to the provider's support team. For AWS Bedrock, look it up as
requestIDin AWS CloudTrail.
Read these together when an agent reports a failure that the gateway's own status does not explain. For a Microsoft 365 Copilot connector, see Troubleshooting.
Related
- Request Log — the administrator's reference for the whole page
- Agent Session Forensics: Overview — read a coding agent's whole session instead of one request
- Onboarding Your Agent — connect an agent so its activity appears here
- Policies — what decides how a request ends