Reading a Session
One agent session answers several different questions, and no single picture answers all of them. HYPR AgentPass™ draws the same session five ways. You can switch between them without losing your place: the entry or entity you selected stays selected as you move between them.
Every representation shows the same activity. Choosing one changes what is easy to see, never what is included.
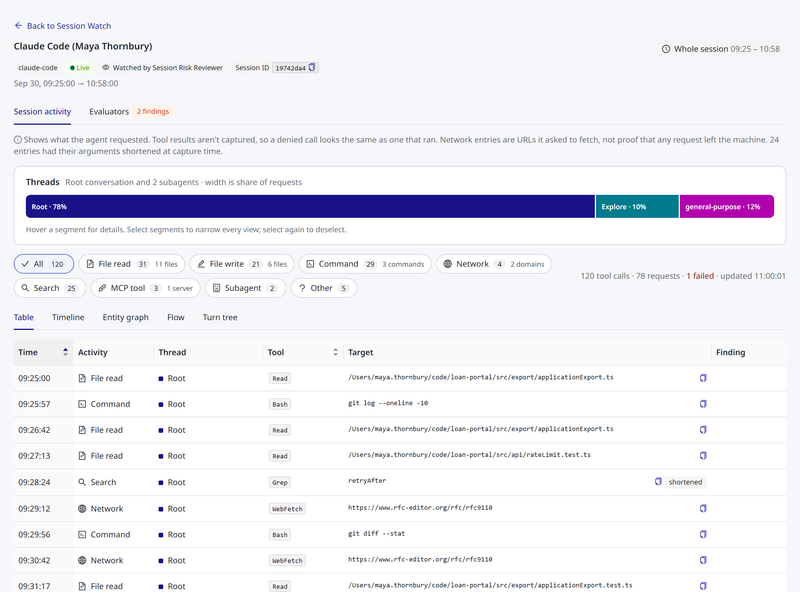
The Five Representations
Each representation answers a different question.
| Representation | The question it answers |
|---|---|
| Table | What exactly happened, in order? |
| Timeline | When did it happen, and how long were the pauses? |
| Entity graph | What did this session touch, and which thread touched it? |
| Flow | Where did the volume go? |
| Turn tree | Which turn asked for what? |
Table
The table lists every classified tool call, in order. It is the canonical representation: every other view presents these same rows differently. Use it when you need to read values exactly, or work with a screen reader.
Each row shows these columns.
| Column | Shows |
|---|---|
| Time | When the call was requested |
| Activity | The kind of activity, such as Command or File write |
| Thread | The thread the call belongs to, when the session has more than one. See Subagent Attribution |
| Tool | The tool name, as the agent's client declared it |
| Target | The command, path or URL the call named, with a copy control. Long targets are shortened in the cell. Hover over one to read the full value. A shortened tag means the arguments were cut short when they were captured, so the value itself may be incomplete |
| Finding | The highest open finding an evaluator reported on the call, when the session is watched. See Session Watch. It also shows Failed when the request failed. A failed request is the request's own outcome, not a finding, so a call that both failed and was flagged shows both |
Select a row to open the call in a drawer with its full target, what it touched and any findings on it. From there, you can step through the calls in order, or open the full request. See The Tool-Call Drawer.
Timeline
The timeline shows what happened, in what order, with the gap between each action. It is a feed, not a diagram. Each entry carries its command, path or URL as text, with a clock time and the time elapsed since the previous action. "+2s" or "+14m" tells you the pace of the work without measuring anything.
Entries are newest first by default. Long idle stretches collapse into a labeled break that states their true duration. A session spread over a day and a half stays readable, without hiding how long the quiet period lasted. Gaps are recalculated against whatever you filtered to, so the intervals always describe the entries you can see.
Entity Graph
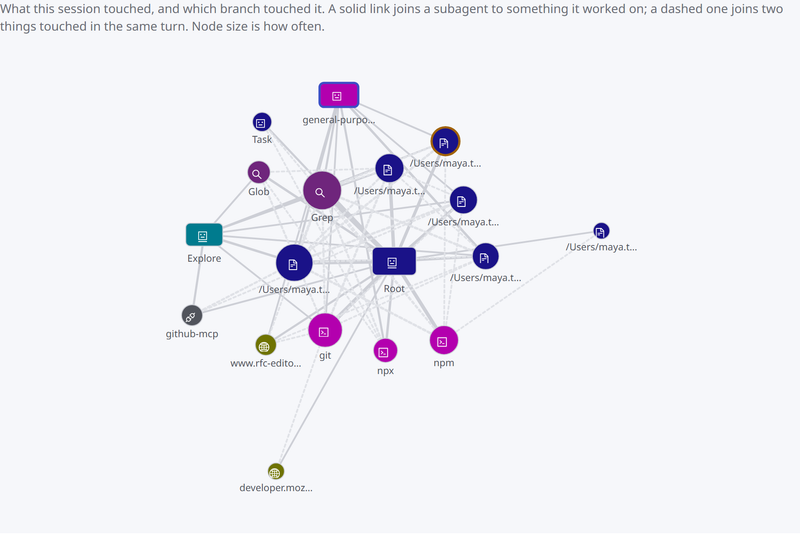
The entity graph shows the shape of the session: which files, hosts, commands and MCP servers it touched, and which thread touched them.
- A solid link joins a thread to something it worked on.
- A dashed link joins two things touched in the same turn.
- Node size shows how often something was touched.
Threads and the things they touched differ in shape as well as color, so the distinction never depends on color alone. A node with a highlighted ring matched one of the AgentPass review hints, such as a sensitive path. It is a hint to review, not a finding.
Nodes group what they stand for: files by directory, URLs by host, commands by executable and MCP tools by server. Select a node to open it in a drawer. The drawer lists every item behind the node's label, each with how often it was touched and a copy control, along with any review hint it matched.
Flow
The flow diagram shows where the volume went. It runs from left to right, through these columns.
| Column | Shows |
|---|---|
| Branch | The thread that made the calls. Shown when the session has more than one thread |
| Connector | The connector the calls went through. Shown only when the session used more than one |
| Activity | The kind of activity |
| Touched | What the calls touched: a file, a command, a host or an MCP server |
| Outcome | Requested or Request failed |
Node height and band thickness both show the number of calls, so the heavy paths are the wide ones. Select a node in the Touched column to open its detail.
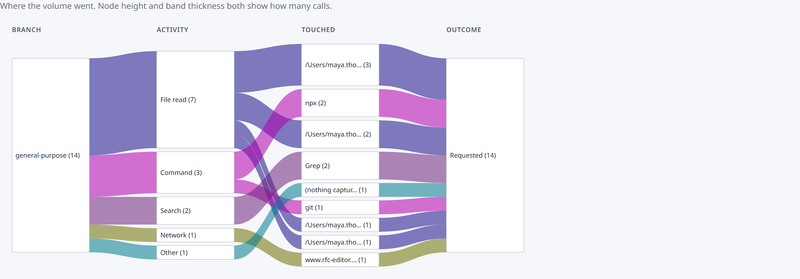
Very long tails collapse into a labeled "more" node instead of being dropped, so the diagram stays readable without losing the count.
Turn Tree
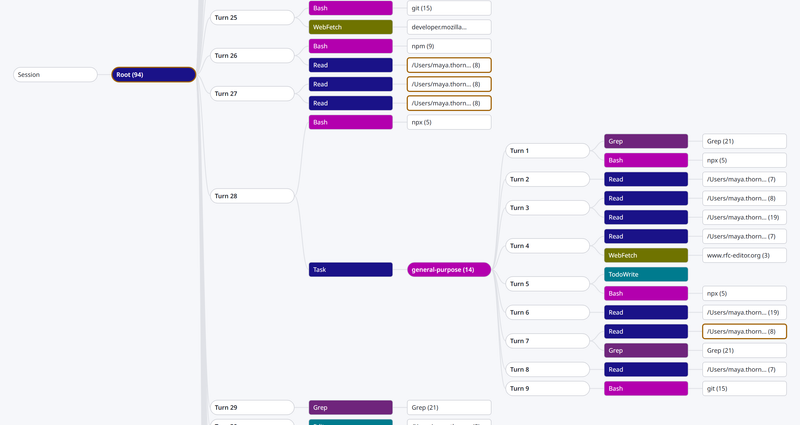
The turn tree shows which turn asked for what: the session, its threads, each turn within them, the calls each turn requested, and what those calls named. When a thread spawned a subagent, that subagent's work is nested under the spawn call that created it. The relationship is visible where it happened, not beside it.
The turn tree shows observed containment: this turn requested these calls, and this call named this target. It is not a causality tree. Tool results are not captured, so AgentPass cannot say that one call's result caused the next turn, and it draws no such link.
When a Representation Cannot Be Drawn
Some sessions cannot be drawn every way:
- A flow diagram needs at least two calls to compare.
- A tree needs at least two turns.
- The entity graph needs something it could resolve to a file, host, command or MCP server. It also declines a session too wide to lay out legibly.
In every case, the tab stays visible but disabled, and states its reason when you hover over it. For example: "A tree needs at least two turns to compare; this session has fewer."
A representation that cannot render truthfully is never hidden. A missing tab would leave you unsure whether the view failed or the session was empty. A disabled tab with its reason tells you which.
Filter What You Are Looking At
Two controls sit above the representations. Both apply to all five at once.
By Activity Kind
Each kind of activity present in the session appears as a chip with its count: File read, File write, Command, Network, Search, MCP tool, Subagent and Other. Where it applies, a chip also says how many distinct things that kind touched, such as 3 files, 8 commands, 2 domains or 1 server. Select chips to narrow the view to those kinds. Click All to clear the selection and return to the whole session.
With only All selected, everything is shown. While anything is hidden, the row says Filtered — some activity is hidden, so a narrowed view is never mistaken for a complete one.
To the right of the chips are the session's totals: its tool calls, its requests, how many requests failed, and when the page last updated.
By Thread
When a session used subagents, the Threads bar lets you narrow every representation to one thread at a time. See Subagent Attribution.
Selection
An entry you select in one representation stays selected as you switch to another.
- Selecting a row in the table, or an entry in the timeline, opens that call's drawer. You can open the underlying request from there.
- Selecting a file, host, command or MCP server in the entity graph or the flow diagram opens a drawer listing every item behind that label. The grouping hides nothing, because every group lists its members.
To clear the selection, click Clear selection in that drawer.
Live Sessions
A session that is still running keeps itself current. While a request has completed in the last five minutes, the page header carries a Live tag, and the page refreshes every 15 seconds. It shows a brief checking… indicator as each refresh lands, and stamps the time beside the session totals, such as "updated 14:22:05." Polling stops by itself once a refresh finds the session quiet. The tag then changes to Idle, with how long ago the session was last active.
Idle means quiet, not finished. Nothing reports that a coding session has ended, so a session goes back to Live if it resumes.
A refresh replaces the data, but never your place in it. Your selection, filters and current representation all survive the update. New activity is briefly highlighted as it arrives. Motion is suppressed for readers who have asked their system to reduce it.
AgentPass records a request after its response completes, one completed request at a time. A turn still in flight is not yet visible.
Related
- Agent Session Forensics: Overview — what a session is, how to open one, and what the record proves
- Subagent Attribution — narrow every representation to one subagent, with per-subagent cost
- Data Management — how long a session's requests are kept