Agent Session Forensics: Overview
A single coding-agent conversation is not one request. It can be a hundred or more, each recorded separately in the Request Log. Read one at a time, those rows answer very little.
Agent session forensics in HYPR AgentPass™ groups them back into the conversation they came from. You see in one place which files an agent read and wrote, which URLs it asked to fetch, which commands it ran, and which MCP tools it called.
Open this view when the question is what an agent actually did: during an incident review, a compliance inquiry, or a spot check on how a coding assistant is being used.
Reviewing agent sessions uses the same permission as the Request Log. Administrators and supervisors who can view the Request Log can open sessions. Supervisors see only the sessions of agents they own.
What a Session Is
A session is every request one coding agent made in one conversation. The agent's client sends a session identifier with each request, and AgentPass records that identifier with the request. Requests carrying the same identifier are one session.
Two coding clients send a session identifier, and both are supported:
- Claude Code
- OpenAI Codex
A session also includes every subagent the conversation spawned, because a subagent inherits its parent's session identifier. Subagent Attribution covers splitting them apart.
The agent's client supplies the session identifier, and the gateway does not verify it. It is a correlation key for grouping requests, never a statement of identity. Where more than one agent has used the same identifier, the session says so. See Where the record is thinner than it looks.
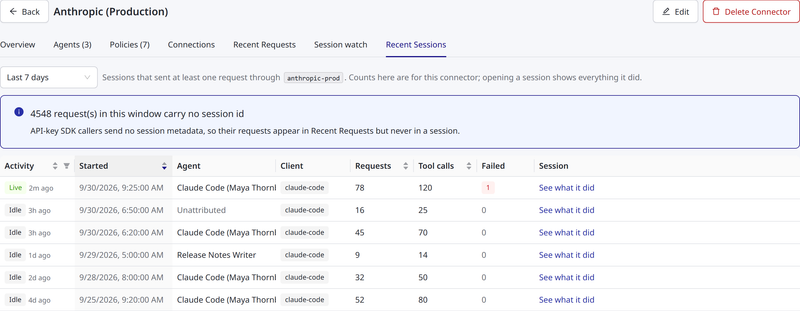
Requests that carry no session identifier are not lost. Session lists report them separately as unsessioned requests, so an empty session list never reads as "no traffic."
Open a Session
You can open a session in two ways.
From a Request in the Request Log
Use this route when you are already looking at one request, and want the conversation around it.
- Open the Request Log, and select a request to open its detail panel.
- Find the Coding session field.
- Click See everything this session did. The whole session the request belongs to opens.
From a Connector's Recent Sessions Tab
Use this route to browse recent activity on a provider, instead of starting from a request you already found.
- Open a connector, and click the Recent Sessions tab.
- Choose the window: Last 24 hours, Last 7 days or Last 30 days. The tab lists the coding sessions that touched the connector in that window. Each row shows the agent, the client, the request and tool-call counts, and the number of failed requests.
- Click See what it did on a row to open that session.
The tab appears only on connectors whose clients send a session identifier: Anthropic, AWS Bedrock and OpenAI. It is not offered on MCP connectors, where the list could only ever be empty.
The Recent Sessions list is scoped to the connector you opened, and its counts cover that connector's requests only. Opening a session still shows everything the session did, across every connector it touched.
What a Session Page Shows
The session page is headed by the agent's name. Beside it are the reporting client, whether the session is Live or Idle, whether an evaluator is watching it, and its Session ID, which you can copy. Beneath the header is the period from first to last activity. The Whole session tag at the right of the agent's name shows the span from the session's first request to its latest.
The Session activity tab then shows, in order:
- What the record proves: one line stating what the record can and cannot prove, followed by anything this particular capture is missing, such as arguments shortened at capture time. You cannot dismiss it. It turns into a warning when activity is actually missing. See What the record proves.
- Threads: where the session used subagents, a bar showing each thread's share of the requests. See Subagent Attribution.
- Filters and totals: one chip per kind of activity, with its count and how many distinct files, commands, domains or servers it touched. The session's tool calls, requests and any failed requests follow.
- The session itself, drawn five different ways. See Reading a Session.
Roles that can view Session Watch also see an Evaluators tab, which shows who is reviewing the session and what they reported. See Session Watch.
Activity is classified into a small set of kinds, so it can be counted and filtered: File read, File write, Command, Network, Search, MCP tool, Subagent and Other. A tool AgentPass does not recognize is classified as Other, and keeps its name. It is never dropped, because a dropped call would give a false picture of a quiet session.
What the Record Proves
This page is evidence, and it is explicit about its own limits. Every session states them in the line at the top of its Session activity tab. Understand them before you draw a conclusion from a session.
A session records the tool calls the agent asked for. Tool results are not captured, so a call the developer denied in their client looks identical to one that ran. Never read a session as proof that an action was carried out.
Entries classified as Network are the URLs the agent asked to fetch. They are not proof that any request left the developer's machine, and they are not a record of network traffic. When an agent runs a command that contains a URL, AgentPass records the command it was asked to run and nothing more. It does not infer that anything was contacted.
Two more limits apply to particular parts of the record:
- MCP tool calls appear as requests, not executions. A session shows the model requesting an MCP tool, on the inference side. The tool's actual execution is recorded separately, on the MCP connector, and is not joined to the session.
- Risk highlights are triage hints, not findings. When an argument matches a pattern worth a second look, the session flags it as needing review. That is a prompt to read the entry, not a detection.
Where the Record Is Thinner Than It Looks
A session tells you when it shows less than the whole picture, instead of presenting a partial record as complete.
| The session says | What it means |
|---|---|
| More than one agent used this session id | Two or more agents sent the same client-supplied identifier, so the activity shown may mix them |
| Arguments were shortened when captured | A long value was capped at capture time, so the entry may be incomplete |
| Some tool calls are not shown | The session exceeded the capture budget or the page limit, and the calls beyond it are missing |
| This is the most recent part of the session | Counts cover a recent slice of a very large session. Earlier activity is not included in the totals |
Watch the last two during an investigation. A session bounded by size reports the bound, and does not quietly round down.
Retention and What a Session Can Show
Sessions are assembled from the request record your organization already keeps. How far back a session reaches therefore follows your data management configuration, specifically the platform-set retention window of the Activity category.
Once a session's requests age past that window, they are removed, and the session goes with them. Sessions are not stored separately from the requests they describe. There is one record, governed once.
The Leaves the gateway as settings on the Data Management page do not affect what a session shows. They govern how an attribute is written to exports and the log stream. The console reads the gateway's own record, which is kept as captured.
Related
- Reading a Session — the five ways a session is drawn, the filters and live sessions
- Subagent Attribution — split a session into the threads that made it, with per-subagent cost
- Session Watch — have an AI agent review sessions and report back