Request Log
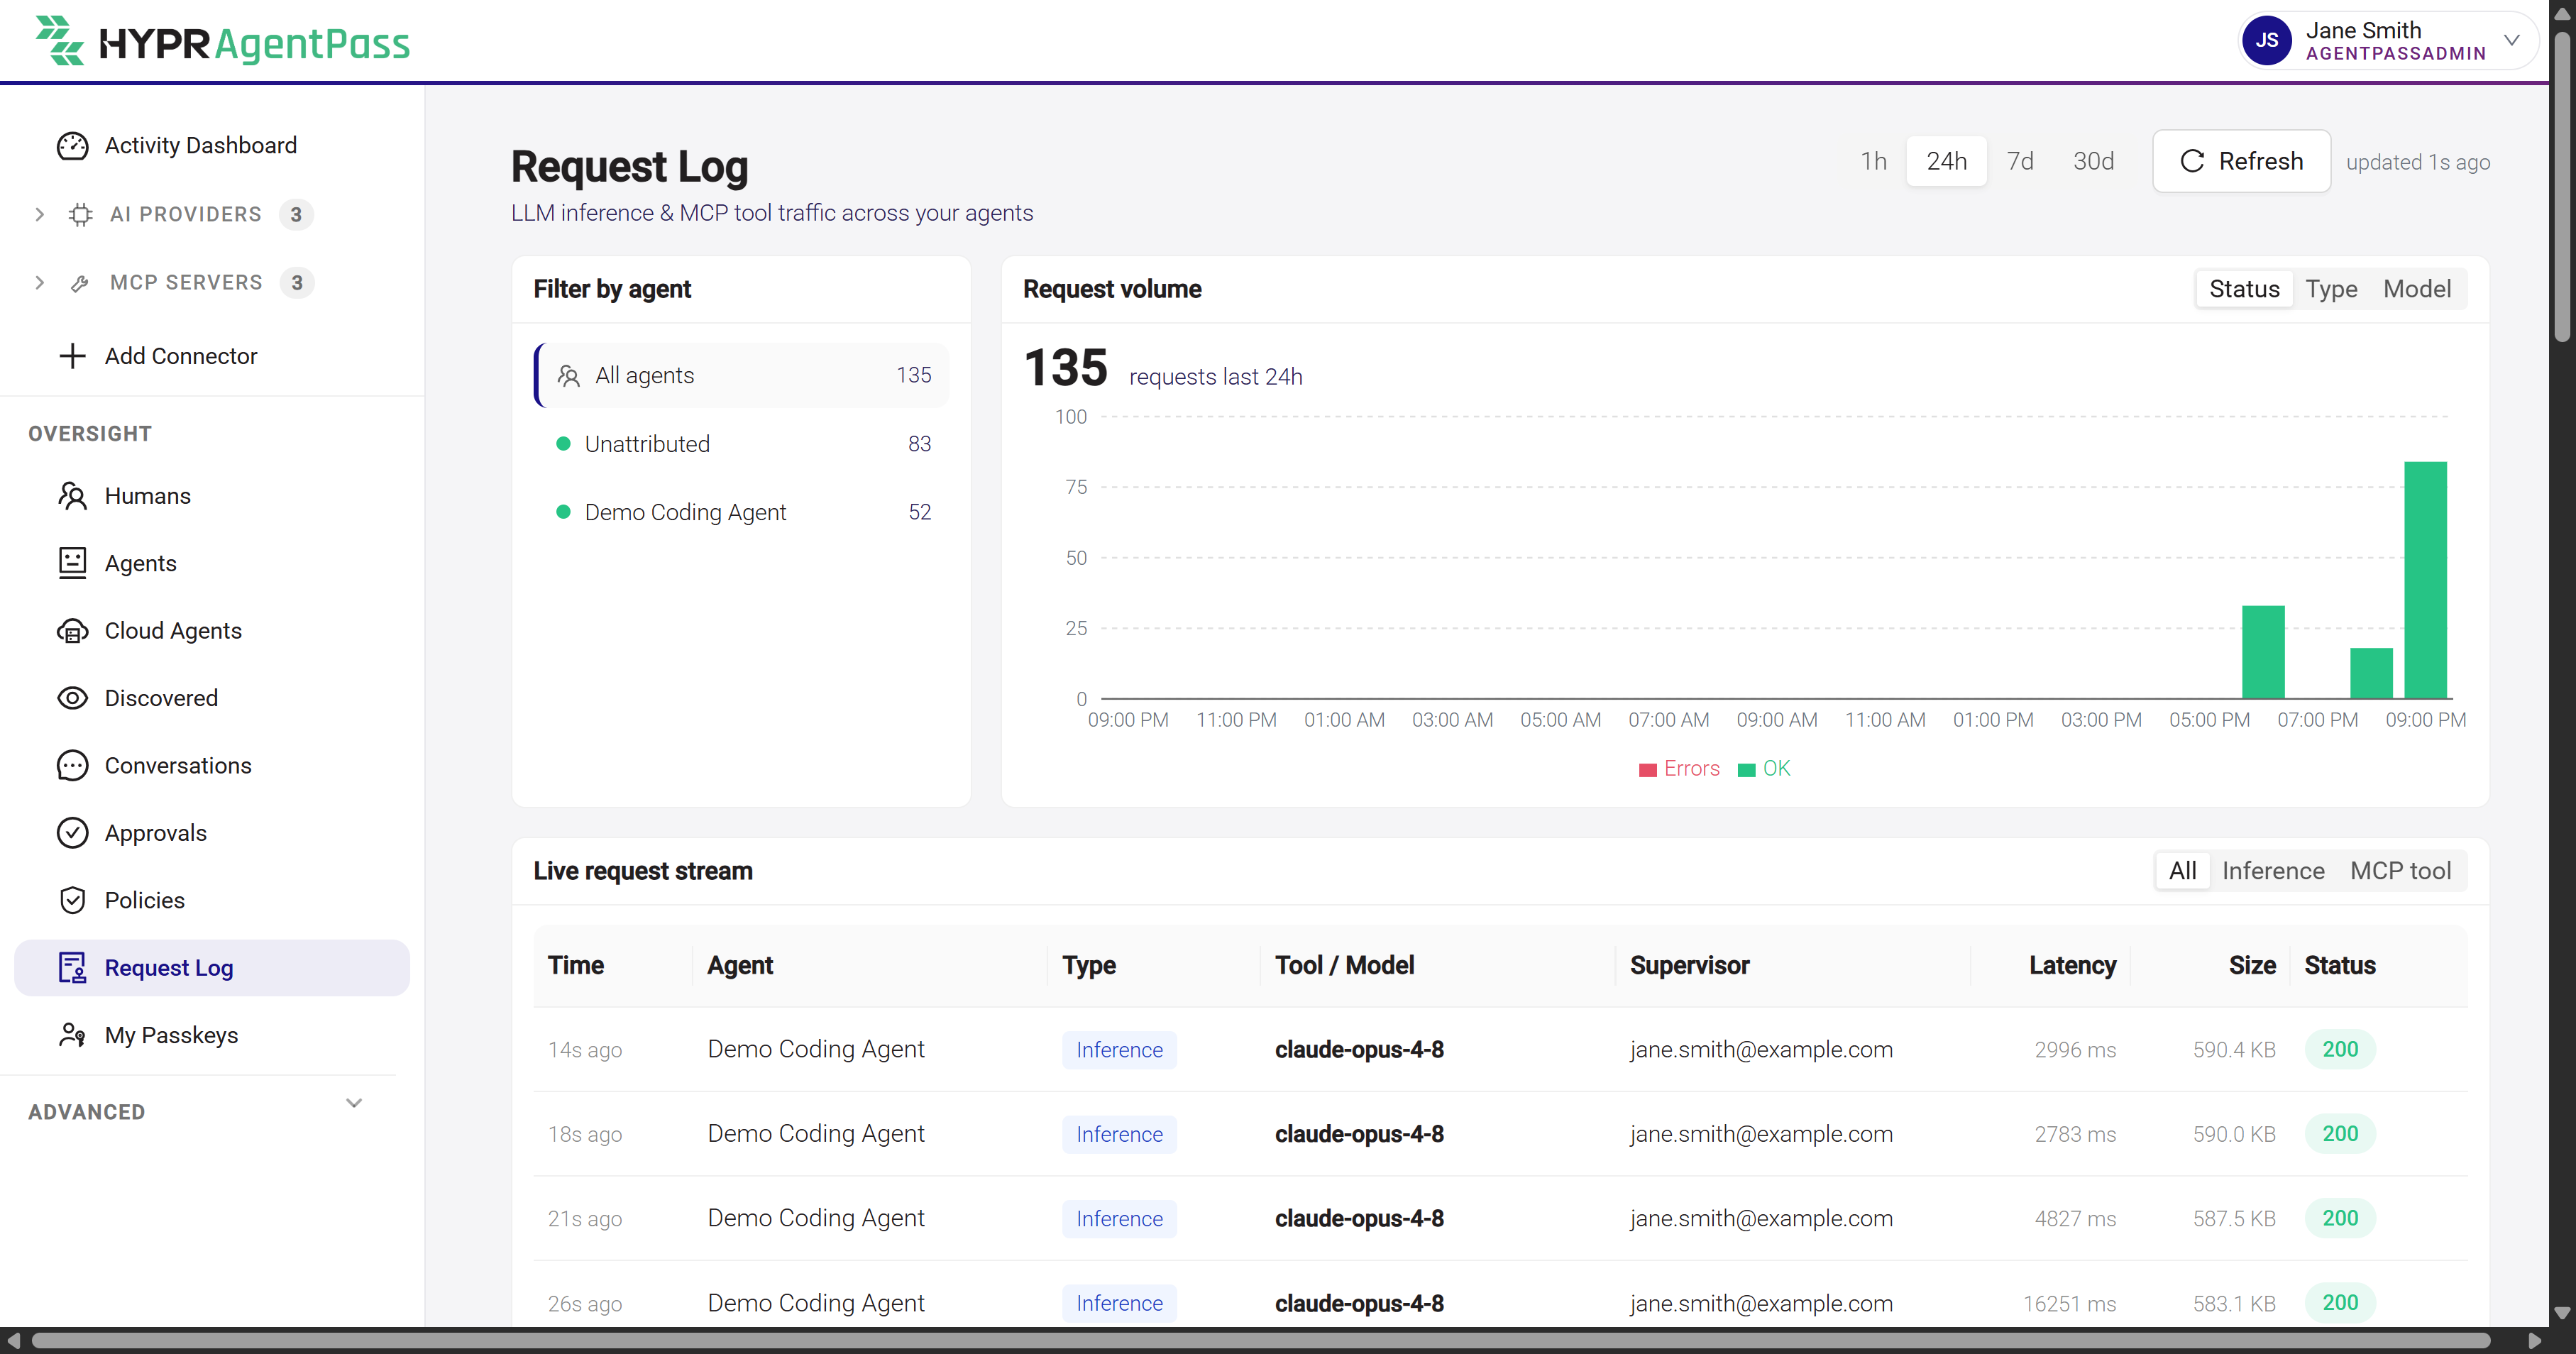
The Request Log lists the traffic your agents send through HYPR AgentPass™: every inference call to a language model, and every MCP tool call. Each request is attributed to the agent that made it and to that agent's supervisor. Open it from Oversight → Request Log.
This page is the reference for administrators and operators. For a supervisor's view of the page, and a closer look at one request, see Viewing the Request Log.
Who Sees What
The Request Log permission decides whose requests a role sees. See Permissions by Role.
| Role | Requests shown | Filters available |
|---|---|---|
| AgentPassAdmin, AgentPassOperator | Every supervisor's requests | Type, classification and supervisor |
| AgentPassSupervisor | Requests from agents the supervisor is responsible for | Type |
A role whose Request Log permission is limited to its own records sees only requests supervised by that user, on every part of the page.
The classification filter appears only for a role that can view Data classification, and only when your organization has classification tiers. The supervisor filter appears only for a role that sees every supervisor's requests, and only when more than one supervisor has traffic in the time range.
The Page Header
The header sets what the rest of the page covers:
- Time range. 1h, 24h or 7d. The default is 24h. The range applies to the summary cards, the chart, the stream and the supervisor filter.
- Refresh. Fetches the latest activity, and returns the stream to its first page. The page does not refresh itself.
- Updated. How long ago the page last fetched its data.
The time range reaches back up to 7 days. The platform sets how long each category of event is kept. See Data Management. A request older than the time range can still be opened from a policy decision that links to it. See Open a Request from a Policy Decision.
Summary Cards
Five cards summarize the time range. Hover over a card for its breakdown.
| Card | Shows | On hover |
|---|---|---|
| Health | The share of requests that succeeded. The label names the time range, such as success last 24h | How many of all requests succeeded |
| Requests | The number of requests | Inference calls and tool calls, separately |
| Tokens | Input and output tokens together | Input and output tokens, separately |
| Avg latency | The average latency | Average across all requests |
| Active agents | The number of distinct agents that sent traffic | How many requests carried no agent identity, or All requests attributed |
The cards follow the time range only. The stream filters do not change them.
Request Volume
Request volume plots the requests in the time range over time. Switch the view between Requests, which separates successes from errors, and Models, which stacks inference calls by model. A model the gateway could not identify shows as Unknown.
Like the summary cards, the chart ignores the stream filters.
Request Stream
The Request stream lists individual requests, newest first. It loads 50 at a time. Load more, at the end of the list, fetches the next set.

Filter the Stream
These filters narrow the stream. Each one returns the stream to its first page.
| Filter | Options |
|---|---|
| Type | All, Inference or MCP tool |
| Classification | Any classification, or one of your organization's tiers |
| Supervisor | All supervisors, or one supervisor. The list is searchable |
The classification filter matches the tier a call carried when it was made. See Classifying the Data Your Tools Handle.
Columns
Each row shows these columns, from left to right.
| Column | What it shows |
|---|---|
| Status | The status code. A request that did not succeed also shows its category. See the following table |
| Time | The time of day for today's requests, otherwise the date and time. Hover for the full timestamp |
| Agent | The agent's name, or Unattributed. An AWS Bedrock or AWS Bedrock Mantle request adds an icon that opens its AWS caller details. See Connecting AWS Bedrock |
| Model / MCP | The model, or the MCP tool or method. An inference call that asked for tools adds how many |
| Data | The classification tier and tags the call carried |
| Supervisor | The supervisor responsible for the agent |
| Latency | A bar on a 0 to 12 second scale, with the value. Hover for model and gateway time |
| Size | The size of the request |
| Tokens | Input and output tokens |
The status category tells you how a request ended.
| Category | Status |
|---|---|
| Policy | 403 |
| Rate limit | 429 |
| Timeout | 504 |
| Server | Any other 5xx status |
| Client | Any other 4xx status |
| Redirect | A 3xx status |
Request Detail
Click a row to open Request detail. The row stays highlighted while the panel is open.
The panel opens with how the request ended, such as Succeeded, Blocked by policy or Timed out. It then shows:
- The latency, time to first byte, gateway time, tokens and payload size
- A What happened timeline
- The call's data classification, and what its session had already read, when they apply
- The coding session the request belongs to, when the agent reported one
- The tool calls the model requested
- The captured Request and Response, with their headers and bodies, and the whole body behind a cut one when your deployment keeps it
- What the upstream returned, when it differs from what the gateway returned
- The supervisor responsible for the agent, as Supervised by
For what each part shows, and how to read the captured bodies, see Inspect a Single Request.
Open a Request From a Policy Decision
A policy decision links to the request that caused it. Following that link opens the Request Log with the request's detail panel already open. It opens even when the request falls outside the current time range. Closing the panel returns you to the stream.
See Investigating a Policy Decision.
When Export Files Stop Being Written
A role that can view Data management sees a banner on this page when a gateway node cannot write its export files. The banner reads Event export files are not being written, and names the cause. It also gives the number of failed writes, how many nodes are affected and when the failures started.
Requests still reach the Request Log while the banner shows. The export files you collect for the same period are missing records. Check the export directory on the affected gateway nodes, including its free disk space and write permissions.
The banner clears once the node writes its export files again. It also appears on the Data Management page.
Related
- Viewing the Request Log — the supervisor's view, and how to read one request in depth
- Activity Dashboard — tiles, approvals and top lists across the gateway
- Data Management — what the gateway records, and where it is sent
- Agent Session Forensics: Overview — read a coding agent's whole session instead of one request