Activity Dashboard
The Activity Dashboard is the first page of the HYPR AgentPass™ console. On one screen, it shows what is connected, what is running, and what people have been asked to decide.
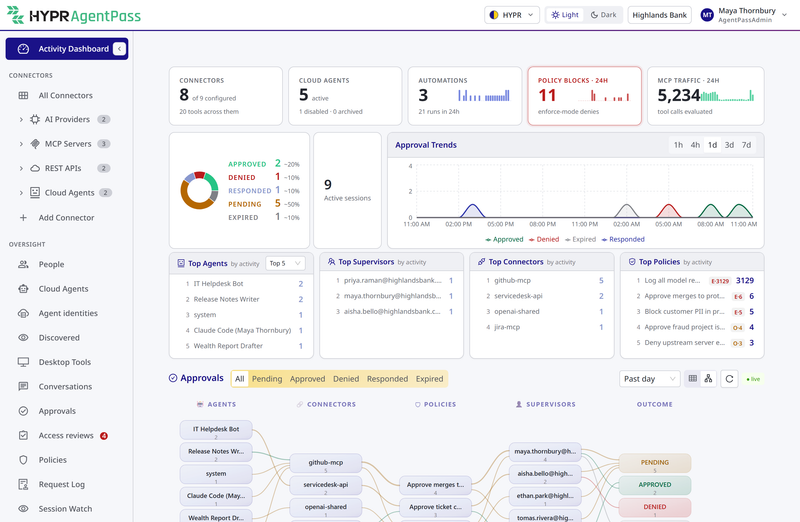
Tiles
The tiles across the top summarize the gateway.
| Tile | Shows | Detail lives in |
|---|---|---|
| Connectors | Enabled connectors out of those configured, and the tools they expose | Connectors |
| Cloud Agents | Active, disabled and archived managed agents | Provider-Managed Cloud Agents |
| Automations | Automations, and their runs in the last 24 hours | Automating Cloud Agents |
| Policy Blocks · 24h | Requests a policy blocked in the last 24 hours | Policy |
| MCP Traffic · 24h | Tool calls evaluated in the last 24 hours | Request Log |
Click a tile to open the console page behind it. Policy Blocks · 24h opens Connectors, where each connector's Policies tab lists its decisions. MCP Traffic · 24h opens the Request Log.
What You See Depends on Your Role
Administrators and operators see the whole organization. A role whose Request Log permission is limited to its own records, such as AgentPassSupervisor, sees a narrower dashboard:
- Tiles. Connectors and Policy Blocks · 24h are not shown. Cloud Agents counts the agents you created. Automations and MCP Traffic · 24h count your own.
- Approvals. The counts, the chart and the Approvals panel cover requests from agents you supervise, and requests you answered.
- Active sessions. Counts the sessions of agents you supervise.
- Top lists. Top Policies is not shown.
See Permissions by Role.
Approvals
The approvals area shows what people have been asked to decide:
- The donut splits approval requests into Approved, Denied, Responded, Pending and Expired. Approved, Denied, Responded and Expired count requests resolved in the last 24 hours. Pending counts every request still waiting, whatever its age.
- Active sessions counts the agent sessions currently connected.
- Approval Trends charts outcomes over 1h, 4h, 1d, 3d or 7d. The default is 1d. This selector changes the chart only.
- The Approvals panel, at the bottom, lists requests for the selected period and outcome filter: All, Pending, Approved, Denied, Responded or Expired.
The Approvals panel switches between a flow graph and a table. The flow graph is the default. It runs from agents to connectors, policies, supervisors and outcome. Hover over a path to highlight it. The live tag shows that the panel refreshes itself every 30 seconds.
To act on a request, or to revoke an approval already given, open Approvals.
Filter the Approvals Panel
Several controls narrow the Approvals panel:
- The donut. Click a status, such as Denied, to show only that status. It clears every other filter.
- Active sessions. Click the card to return the panel to All, with no filters.
- The top lists. Click a row to show only that agent, supervisor, connector or policy. It clears the other filters. A policy row also sets the status to Denied.
- The status buttons. All, Pending, Approved, Denied, Responded or Expired.
- The time window. Past hour, Past 4h, Past day, Past 3 days or Past 7 days. The default is Past day.
A top-list filter appears as a chip, such as Agent: … or Policy: …. Close the chip to remove that filter. Click the refresh button to fetch the latest requests.
Approvals Panel Columns
The panel lists up to the 100 most recent requests in the window, 30 to a page. In the table view, each row shows these columns.
| Column | What it shows |
|---|---|
| Time | How long ago the request was raised. Hover for the full timestamp |
| Status | Pending, approved, denied, responded or expired |
| Agent | The agent that made the request |
| Connector | The connector it was sent to |
| Request | The method, the path and the approval message |
| Type | Policy, Agent or Onboarding: what raised the approval |
| Supervisor | The supervisor asked to decide |
| Resolved | How long the decision took, or waiting while it is pending |
A shield icon at the end of a row marks a request that carries an action digest.
Approval Flow
Click a row in the table view to open Approval Flow. It is a read-only view of one approval. To decide or revoke, use the Approvals page. Only the table view opens Approval Flow.
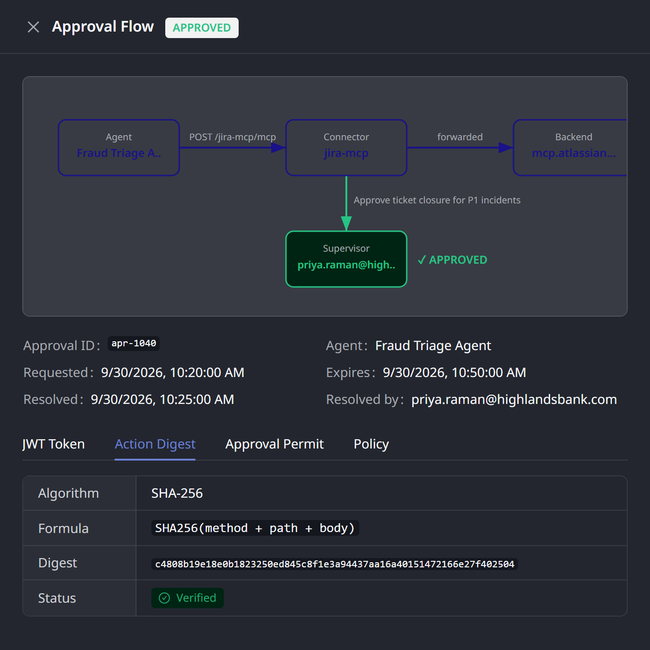
The drawer shows the approval's status and a diagram. The diagram traces the request from the agent through the connector to the backend, and to the supervisor asked to decide. The path to the backend is dimmed for a denied or pending request.
The summary lists the Approval ID, Agent, Requested and Expires fields, plus Resolved and Resolved by once the request is resolved.
The drawer's tabs hold the records behind the approval. A tab with nothing to show is disabled.
| Tab | Shows |
|---|---|
| JWT Token | The claims in the agent's token |
| Action Digest | The digest of the action the agent asked to perform, and how it is computed from the method, path and body |
| Approval Permit | For an approved request, the supervisor, the decision, when it was made and any comment |
| Policy | The policy that raised the approval, its type and message, the request and the connector |
Top Lists
Top Agents, Top Supervisors, Top Connectors and Top Policies always cover the last 24 hours. The period on the chart or the Approvals panel does not change them. The selector on Top Agents, from Top 5 to Top 50, sets how many rows every list shows.
- Top Agents and Top Connectors rank by the approval requests raised.
- Top Supervisors ranks by the requests each supervisor approved or denied.
- Top Policies ranks by matches. A policy's row shows its enforce matches (E·n) and observe matches (O·n), where there are any, then its total.
Click a row to filter the Approvals panel. See Filter the Approvals Panel. To see what no policy reaches, open Policy Coverage.
Related
- Approvals — decide, review and revoke requests
- Agent Session Forensics — open what one active session did
- Data Management — what feeds the dashboard, and for how long
- Request Log — the inference and MCP tool traffic behind the MCP Traffic · 24h tile