Investigating a Policy Decision
A policy can block a request, hold it for approval, or, in Observe mode, record what it would have done. Each time, HYPR AgentPass™ keeps the decision together with the request that caused it. Each connector's Policies tab lists those decisions. Opening one answers four questions in one place:
- Which policy decided?
- What traffic caused it?
- What else did that request set off?
- Why did the rule match?
Investigating decisions is an administrator task. Reading decisions needs the View permission on Policies. The request behind a decision is shown only to a role that can also view the Request Log. See Who Sees What.
When a User Reports a Block
Most investigations start with someone saying their agent was stopped. What they saw already names the policy. A blocked agent receives the policy's name and its message. A held request appears on the Approvals page with the policy that raised it.
- Find the connector. It is the provider or tool server the agent was calling. If you are not sure, find the request in the Request Log, which shows the connector that served it.
- Open its decisions. Go to Connectors, open the connector, and click the Policies tab.
- Narrow to the report. Set the time window to cover when it happened, Policy to the name they were given, and Disposition to Blocked or Approval. Match the row to the agent in the Agent › Tool column.
- Open the row to see why the rule matched and what the request carried. See Open a Decision.
If the rule caught something it should not have, set it back to Observe while you narrow it. See Roll Back.
Find the Decisions
Open Connectors, pick the connector, and click the Policies tab. The tab's count includes every policy that governs this connector: those scoped to it, and the global ones that apply to every connector. The Scope column tells them apart, as this connector or global.
Below the policy list, the Decisions card lists what those policies did to this connector's traffic, newest first.
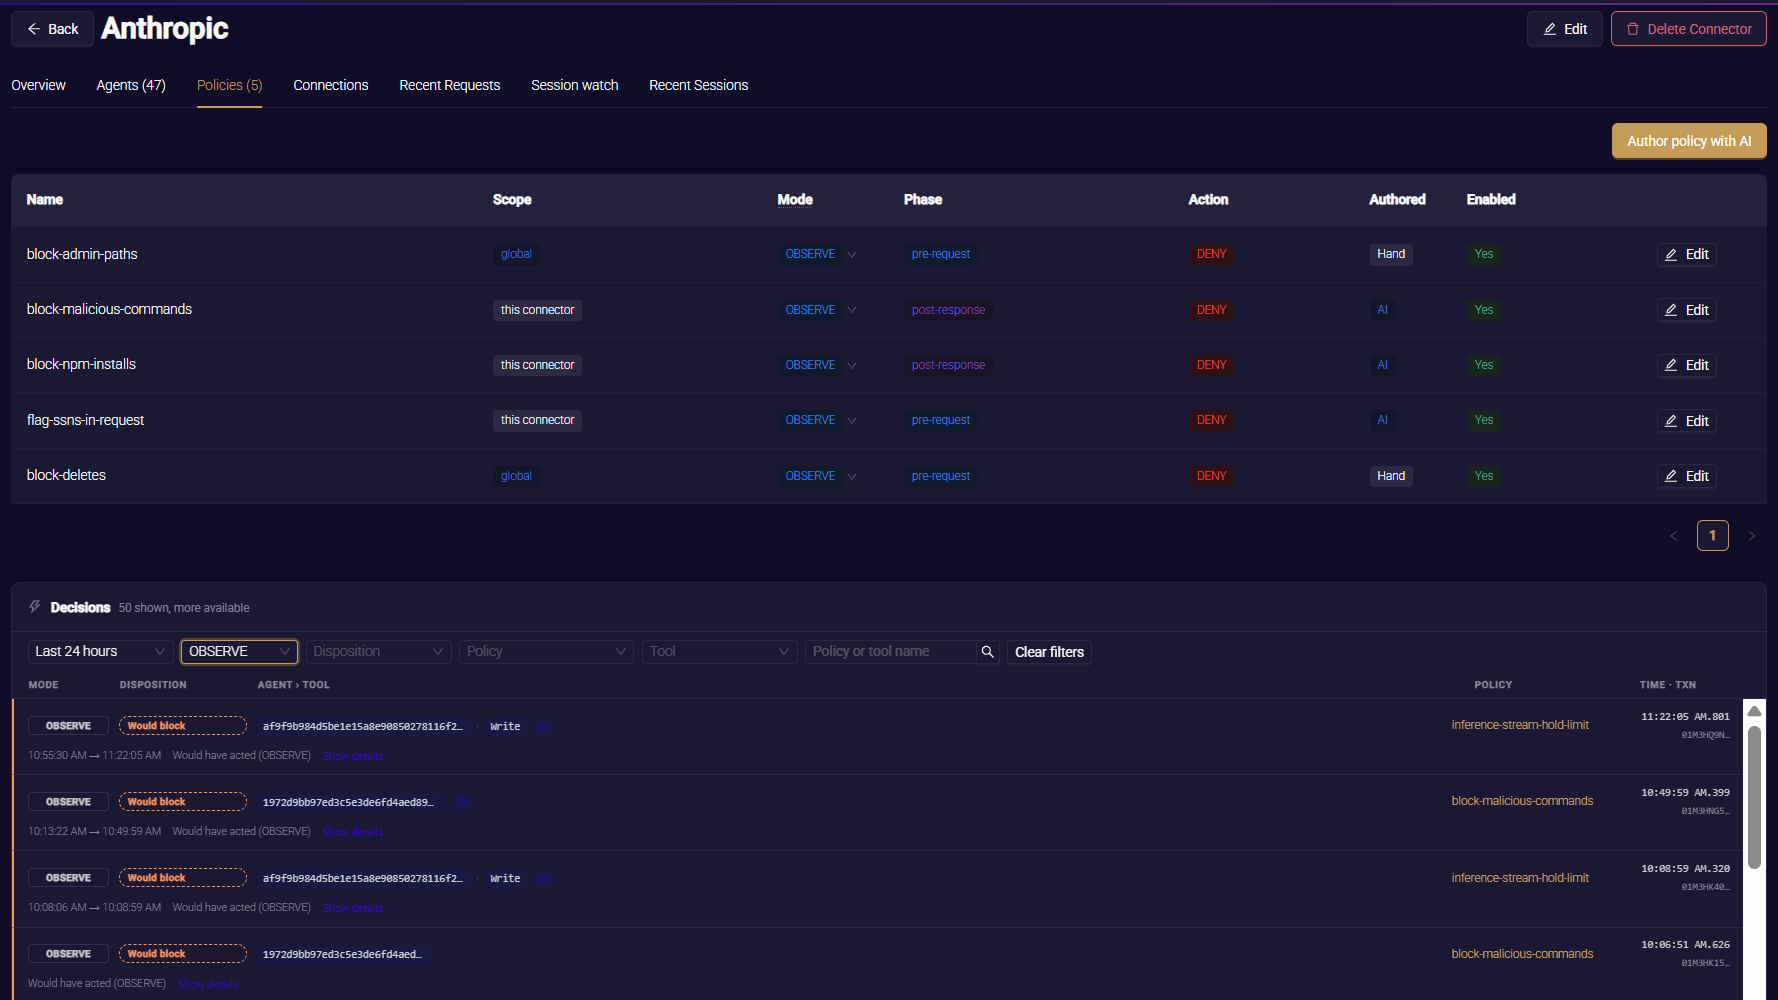
Each row has these columns, from left to right.
| Column | What it shows |
|---|---|
| Mode | ENFORCE when the policy acted on the traffic, OBSERVE when it only recorded a match. Rows that are not policy decisions, such as an approval being raised, show SYSTEM |
| Disposition | What happened to the request. See the following table |
| Agent › Tool | The agent that made the call, and the tool it called. Hover over either for the full value |
| Policy | The policy that decided |
| Time · Txn | When it happened, and the start of the request's correlation ID. Hover for the full timestamp and ID |
Read the disposition first.
| Disposition | Meaning |
|---|---|
| Blocked | The request was refused |
| Would block | An Observe policy matched. Nothing was changed. This is what the policy would have done once enforced |
| Approval | The request was held for a supervisor |
| Resolved | A held request was approved, denied, answered or expired |
| Allowed | An Enforce ALLOW policy matched, and the request went through |
| Info | Anything else worth recording |
Consecutive rows that are identical except for time collapse into one row, with a count such as 3×. The row shows the time range they span.
The connector's Connections tab carries the same rows from the last 24 hours, in its Events card, alongside the connector's other operational events. Clicking a row there opens the same detail.
Narrow the List
The bar above the decisions filters them.
| Filter | Options |
|---|---|
| Time window | Last hour, Last 24 hours (the default), Last 7 days, Last 30 days |
| Mode | ENFORCE, OBSERVE |
| Disposition | Any of the dispositions listed earlier |
| Policy | The policies that govern this connector |
| Tool | The tools in the decisions shown |
| Policy or tool name | A search on either name |
Clear filters returns to the last 24 hours, with nothing else set. The list loads 50 decisions at a time. Load more, at the bottom, fetches the next set.
To follow one thread through the list, right-click a row's Agent › Tool cell, and choose Decisions for this agent, Decisions for this policy or Decisions for this tool.
When nothing is listed, the card tells you why:
- If no enabled policy governs the connector, nothing is being evaluated at all.
- If policies are in scope but none fired in the window, the card says how many are in scope and in which mode, and offers Widen to 7 days.
- If your filters exclude everything, it offers Clear filters.
An Observe policy that never appears here has not matched anything in the window. Before you promote it to Enforce, send the traffic you meant it to catch, and confirm a Would block row appears.
Open a Decision
Click any row. A panel opens on the right, headed with the policy name and the request's full correlation ID, which you can copy. Beneath the mode, disposition and time, it has four sections.
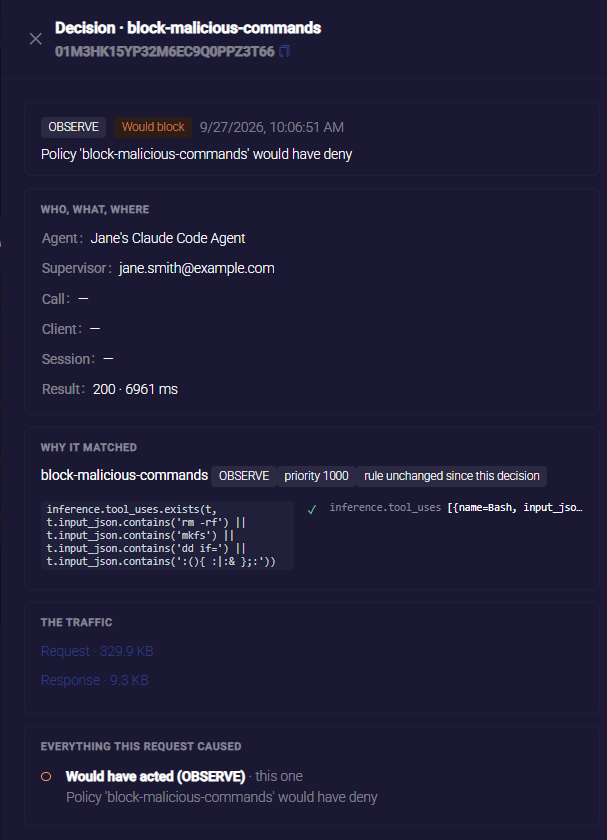
Who, What, Where
This section describes the request behind the decision.
| Field | What it shows |
|---|---|
| Agent | The agent's name, or Unattributed when the request carried no agent identity |
| Supervisor | The supervisor responsible for the agent |
| Call | The method, and the tool called |
| Client | The client software and its version |
| Session | The session the call belonged to |
| Result | The status the call returned, and how long it took |
The request may not be available. It may be older than the Request Log keeps, or belong to a supervisor whose requests you may not see. The panel then says so, and leaves this section out. The rest of the decision is still shown. For an older event with no linked request, the panel says that the traffic behind it cannot be identified.
Why It Matched
This section shows the policy's name, mode and priority, and whether it is global. A tag says whether the rule has changed since the decision: rule changed since this decision, rule unchanged since this decision or rule version not recorded. Beneath that, the rule is broken into its clauses, the parts joined by &&. Each clause is shown as written, with:
- ✓ if the clause held, ✗ if it did not, or ? if it could not be judged on its own
- The value each attribute in the clause resolved to at the moment of the decision
This is the evidence for a decision: not what the rule says today, but what the gateway actually saw. When a clause reads request.method == "DELETE" and the value shown is DELETE, you know exactly which part of the request the rule caught.
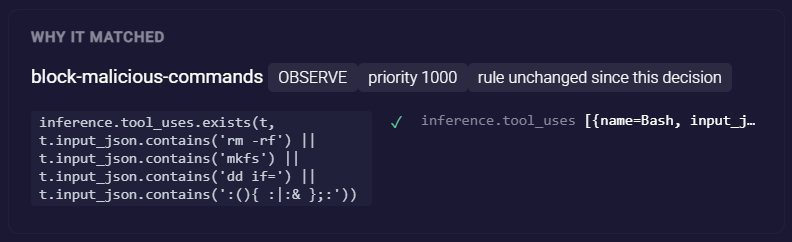
A few cases display differently:
- A rule written with
||is shown as one clause. - A very long value is shortened, and a rule with many clauses records only the first ones. The panel notes when that happened.
- For decisions made before clause values were recorded, the panel shows the rule as written instead.
- Rule changed since this decision means the values were judged against an earlier version of the rule than the one in your policy list now.
- When the policy has since been deleted, the panel says that its rule cannot be shown.
Clause values are recorded as they were, so anyone who can view decisions can read them. A rule that tests a header or tool argument carrying a secret would show that secret to everyone with that permission. Test for the presence or shape of such a value, with has(…) or .startsWith(…), instead of comparing it to a literal secret. By default, clause values are not sent to your external event destinations. An administrator can change how the evidence attribute leaves the gateway on the Data Management page.
The Traffic
This section shows the size of the request and the response. When the payload was kept, each line links to that request in the Request Log, where the detail panel opens on it and shows the body. When it was not kept, the line says why: the body was empty, or payloads are not retained for that tool. When there is no request record, the line says there is no payload to show.
Everything This Request Caused
This section lists every event the same request produced, oldest first, with the one you opened marked this one. A block, the approval it raised, and any other policy that also matched line up here in order. An event that raised an approval carries Open the approval, which takes you to that approval on the Approvals page.
Who Sees What
Each part of an investigation needs its own permission.
| To see | A role needs |
|---|---|
| The connector and its tabs | View on Connectors |
| The decisions list and the decision panel | View on Policies |
| The request behind a decision | View on Request Log |
Where a permission is limited to your own records, the list shows only decisions made by policies you authored. The panel then shows only requests from agents you supervise. The built-in AgentPassAdmin and AgentPassOperator roles see everything. You set permissions in Roles and Permissions.
Related
- How Policies Are Evaluated — modes, actions and what a match does
- Writing a Policy by Hand — the policy form and the connector's Policies tab
- Promoting a Policy to Enforce — using Observe matches to decide when to promote, and rolling back
- Request Log — the full detail of a request, including its body